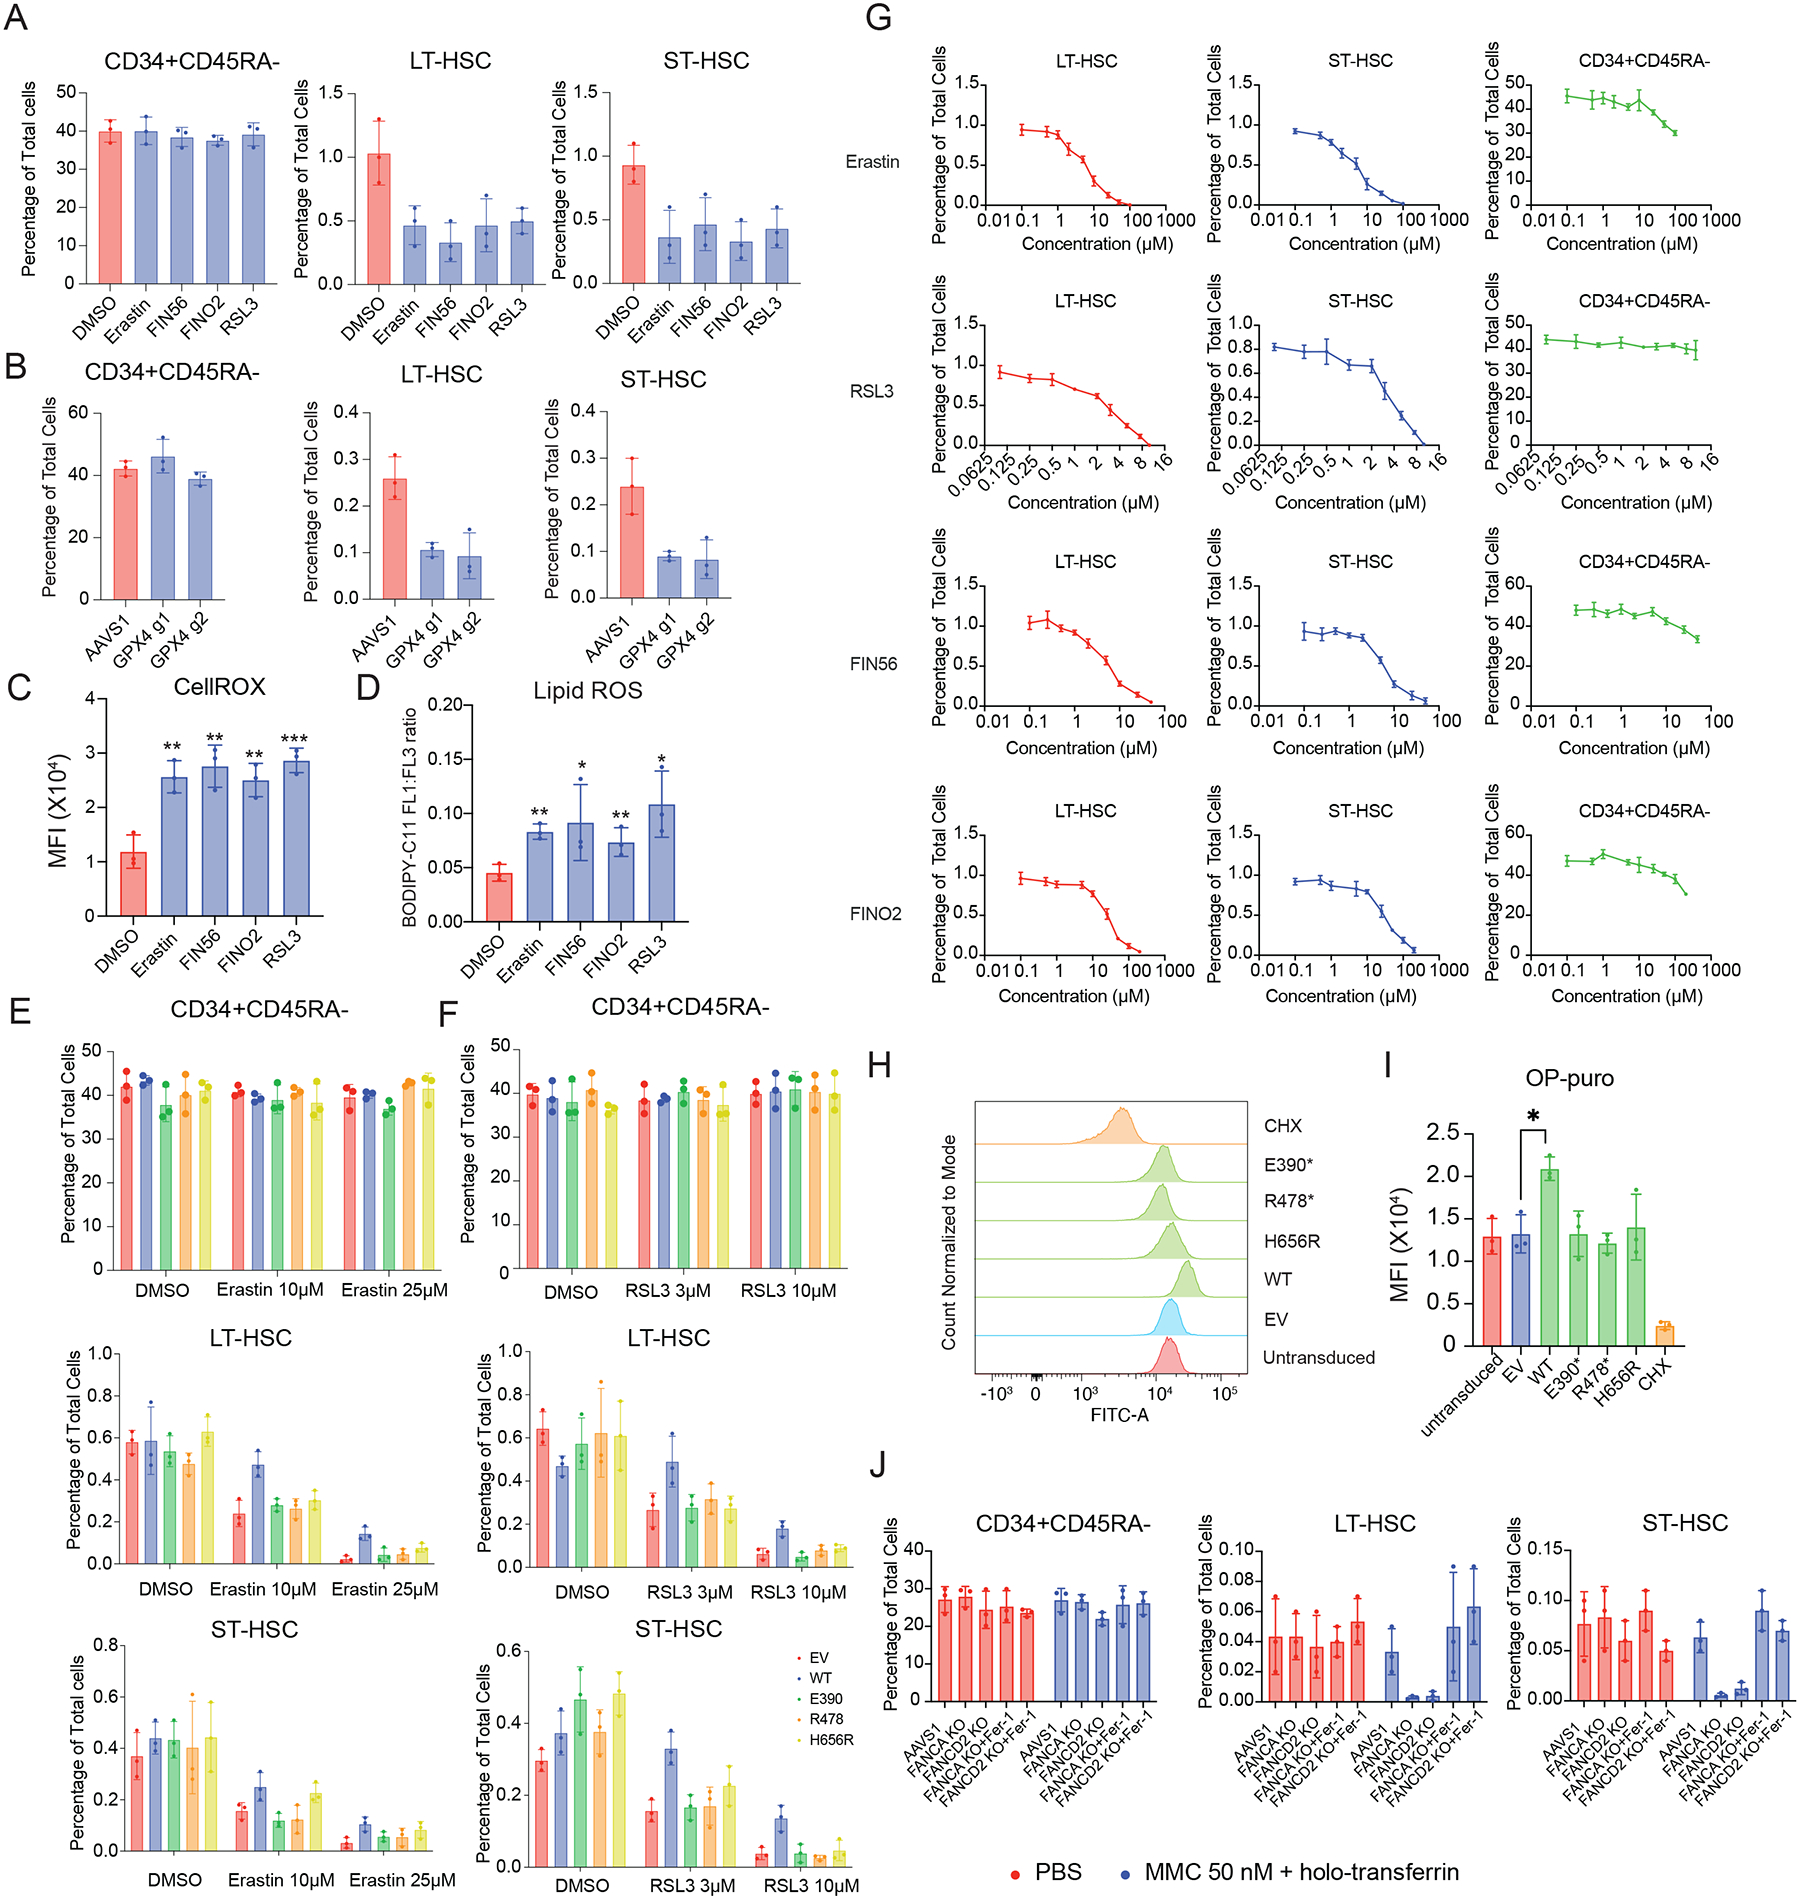
Figure 7. Normal hematopoietic stem cells (HSCs) are susceptible to ferroptosis induction and overexpression of MYSM1 can be protective due to increased translation.

(A) Quantification of CD34+CD45RA−, ST-HSC, and LT-HSC populations in DMSO and indicated ferroptosis inducer-treated CD34+ HSPCs. (B) Quantification of CD34+CD45RA−, ST-HSC, and LT-HSC populations in AAVS1 or GPX4 edited cells. (C) Quantification of mean fluorescence intensity (MFI) of cellular ROS level of sorted CD34+CD45RA−CD90+ cells with DMSO or indicated ferroptosis inducer treatment measured by CellROX dye. (D) Quantification of cellular lipid peroxidation level of sorted CD34+CD45RA−CD90+ cells with DMSO or indicated ferroptosis inducer treatment measured by ratio of oxidized and non-oxidized BODIPY dye. (E) Quantification of CD34+CD45RA−, ST-HSC, and LT-HSC populations in DMSO and Erastin treated cells, and cells treated with Erastin and transduced with indicated constructs. (F) Quantification of CD34+CD45RA−, ST-HSC, and LT-HSC populations in DMSO and RSL3 treated cells, and cells treated with RSL3 and transduced with indicated constructs. (G) Viability curve of CD34+CD45RA−, ST-HSC, and LT-HSC populations, quantified by percentage of cells after five days culture with indicated concentration of ferroptosis inducing agent. (H) Representative flow cytometric histogram of O-Propargyl-puromycin based translation rate analysis on CD34+CD45RA−CD90+ sorted cells transduced with indicated constructs. (I) Quantification of mean fluorescence intensity (MFI) of O-Propargyl-puromycin based translation rate analysis on CD34+CD45RA−CD90+ sorted cells transduced with indicated constructs. (J) Quantification of LT- and ST-HSC populations in AAVS1, FANCA and FANCD2 edited CD34+ HSPCs induced with either PBS or low concentration of mitomycin c and holotransferrin treated with either DMSO or ferroptosis inhibitor Ferrostatin-1.
