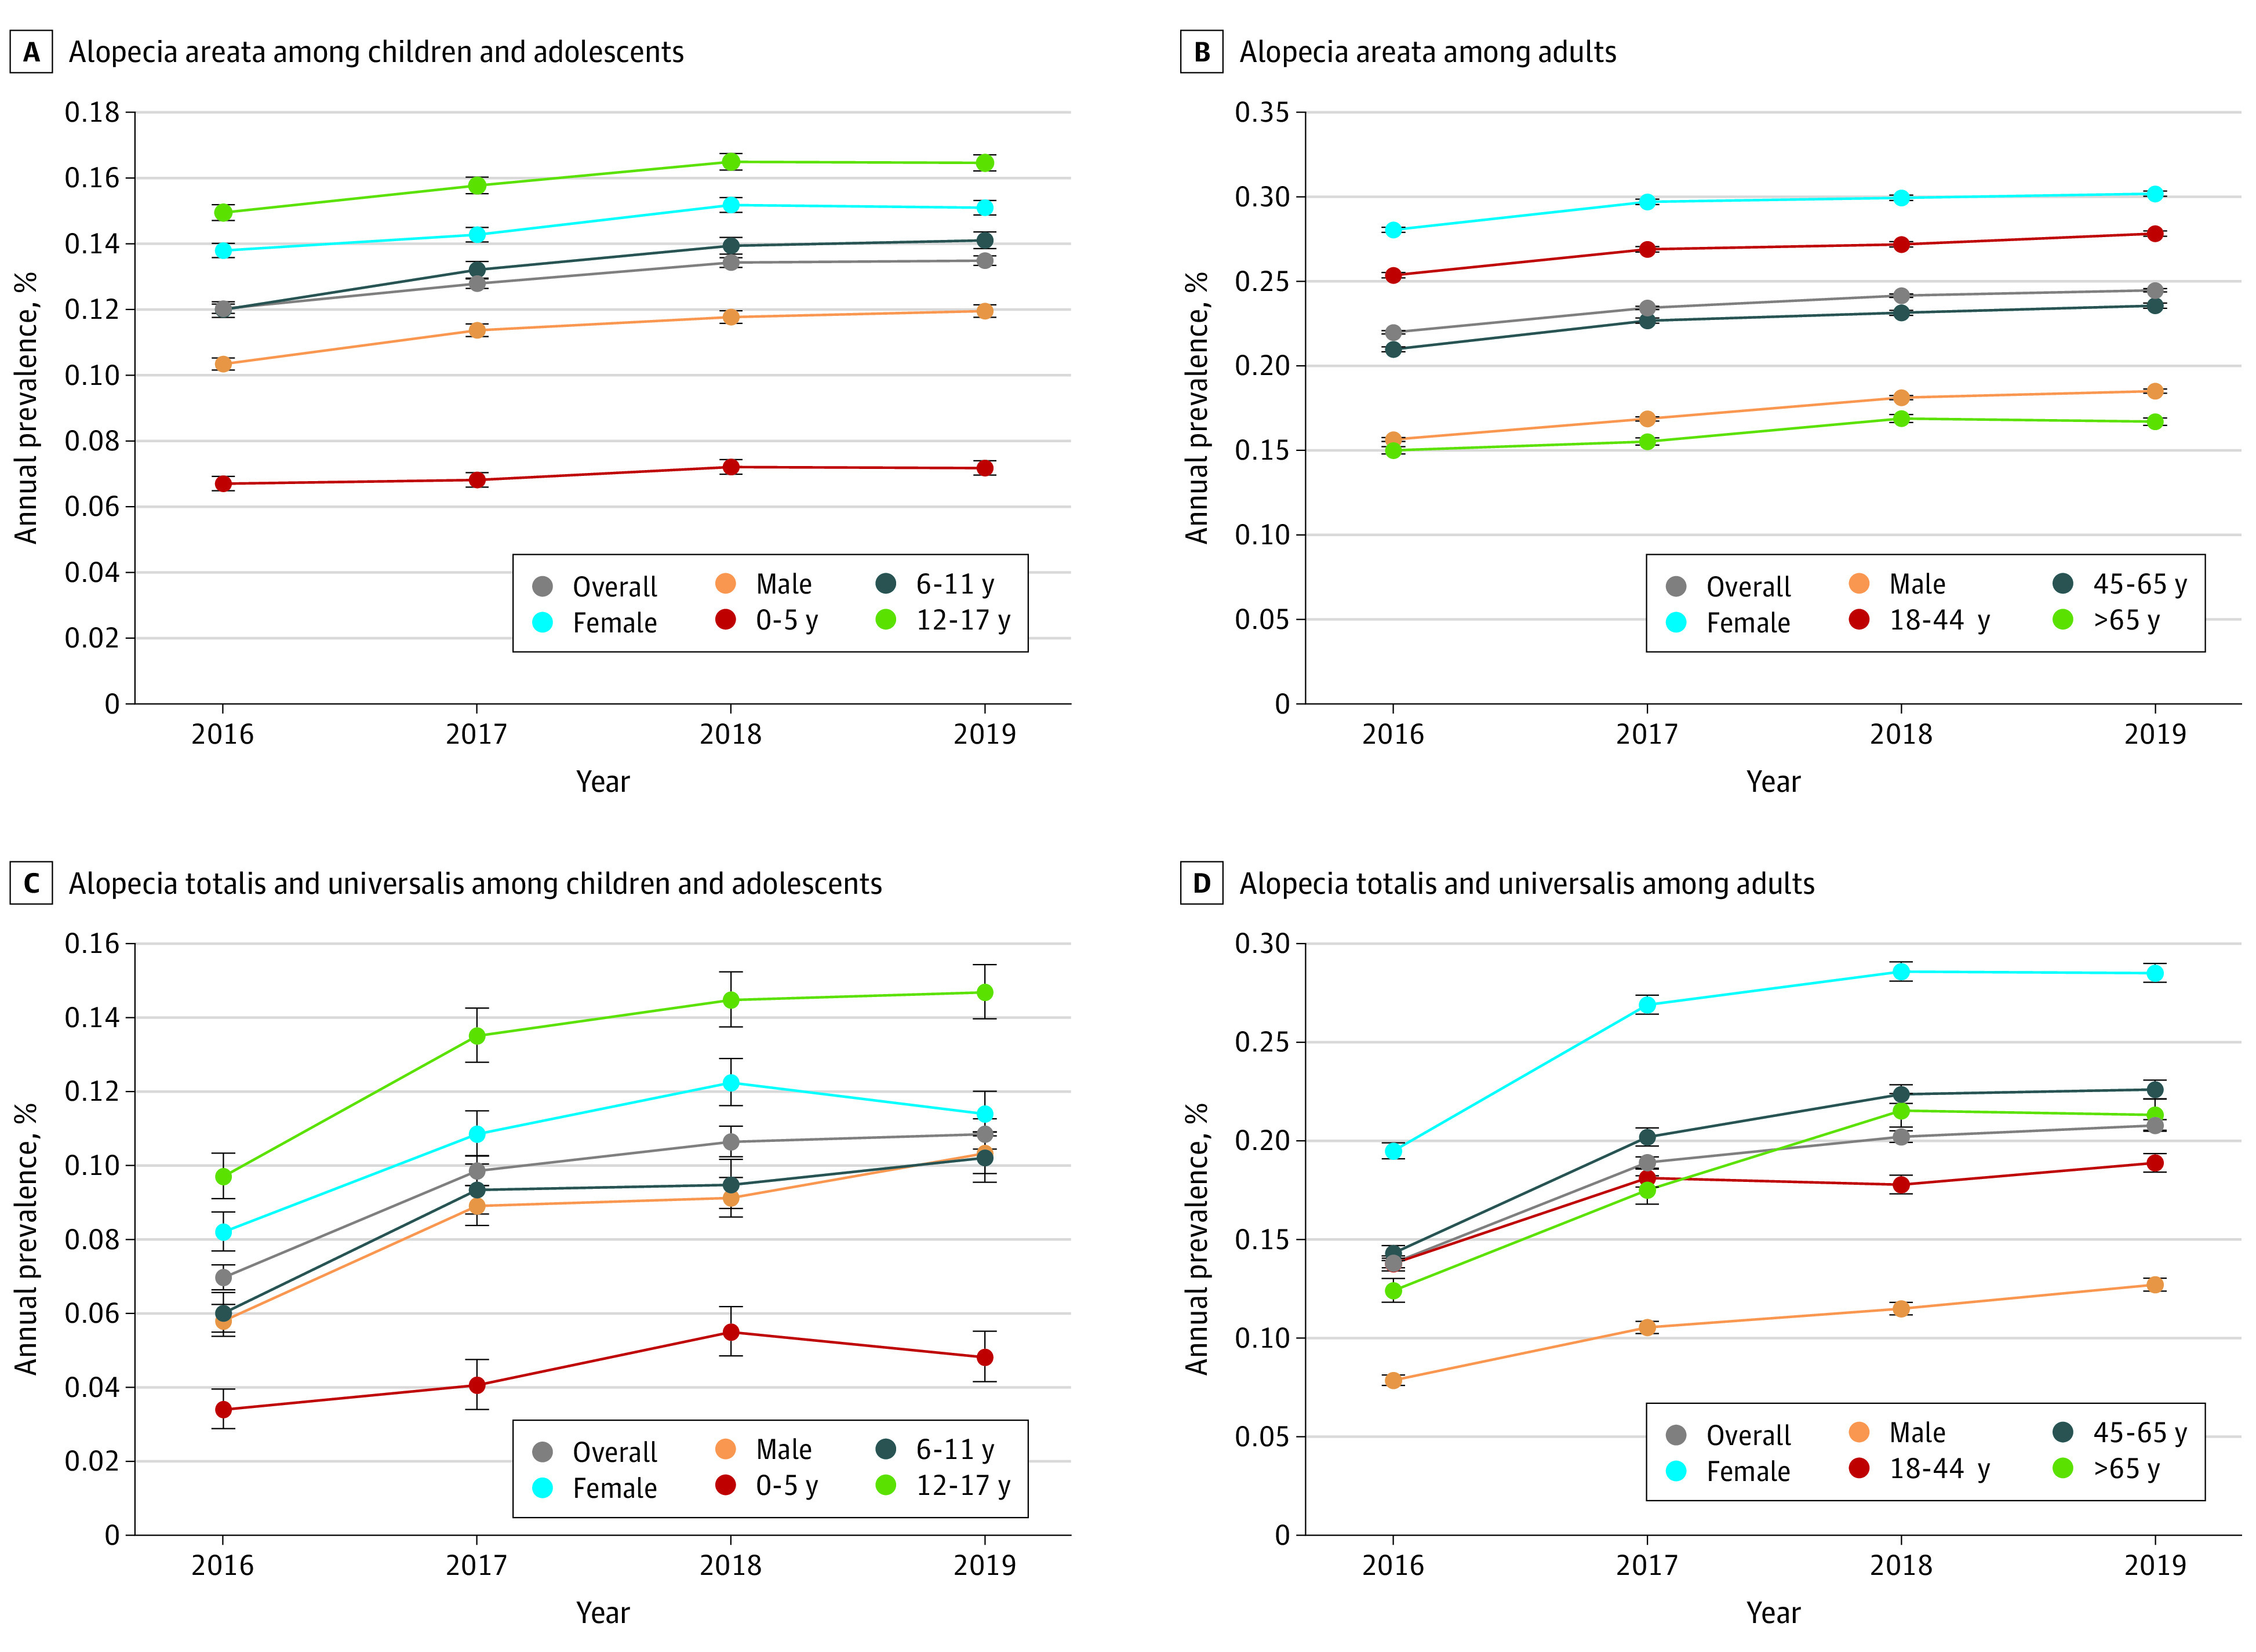
Figure 2. Annual Prevalence of Alopecia Areata (AA) and Alopecia Totalis (AT)/Alopecia Universalis (AU) by Sex and Age Group From 2016 to 2019.

Individual weights in each year (2016-2019) were assigned using data from the American Community Survey based on census division, age, sex, and policy holder status. Annual prevalence was calculated as the number of patients who had at least 1 inpatient or outpatient claim with a diagnosis for AT/AU during the year of analysis or the year prior divided by the number of patients who were continuously enrolled during that period. Binomial exact intervals are shown. The annual prevalence rate during each subsequent calendar year was compared with the annual prevalence rate in 2016 using weighted logistic regression models, with prevalent case status as the dependent variable (cases were coded as 1, noncases were coded as 0) and calendar year indicators included as covariates.
