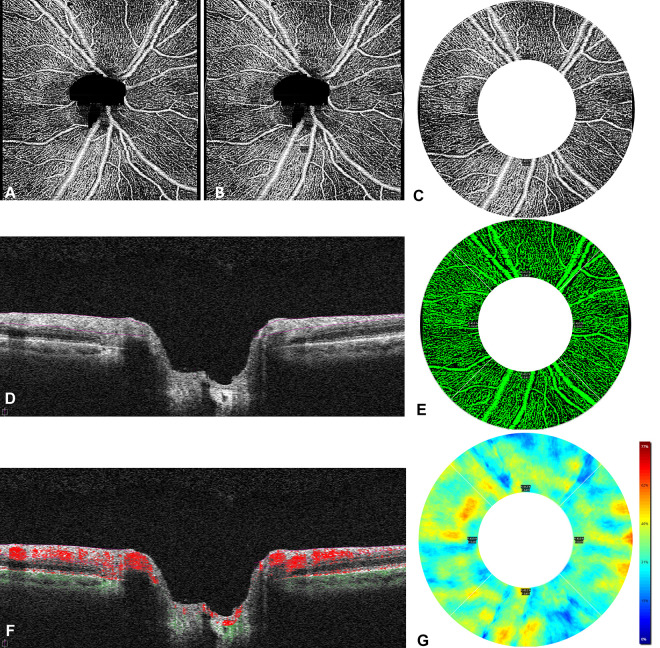
Figure 1.
(A) A 4.5 mm × 4.5 mm peripapillary optical coherence tomography angiography image of the right eye of a study participant is shown. (B) A region of interest, comprising a 2.5-mm wide annulus centered on the optic nerve head with an inner diameter of 2 mm and an outer diameter of 4.5 mm, was overlaid on the image. (C) The areas outside the outer diameter and within the inner diameter, including the optic nerve head, were not included in the analysis. Quantification of the capillary perfusion density and capillary flux index was performed on the 2.5-mm wide annulus. (D) The segmentation boundaries of the radial peripapillary capillary slab extended from the internal limiting membrane to the outer boundary of the retinal nerve fiber layer. (E) A trace map assessing capillary perfusion density was applied within the segmentation boundaries; the perfused vasculature is shown. (F) The flow overlay indicates flow data above the retinal pigment epithelium, and dots indicate flow data below the retinal pigment epithelium. (G) A map of the capillary perfusion density measured as a percentage of the region of interest is shown with its corresponding scale.

