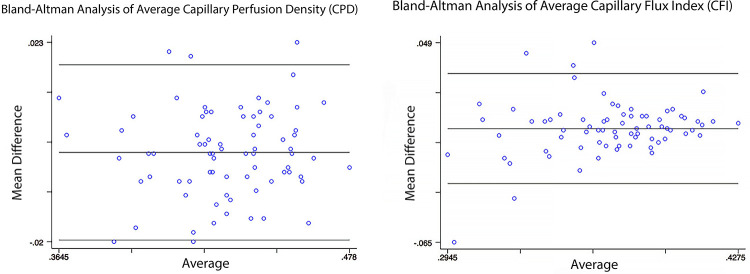
Figure 2.
Bland-Altman plot of average (or whole-image) capillary perfusion density (CPD) and capillary flux index (CFI) measurements. Averages of n measurements (2-4) are shown on the x axis, and mean difference between n measurements is shown on the y axis. The middle lines represent the mean differences (CPD = 0.001; CFI = 0.000) and the upper and lower lines represent the limits of agreement (CPD = –0.020, 0.018; CFI = –0.031, 0.031).

