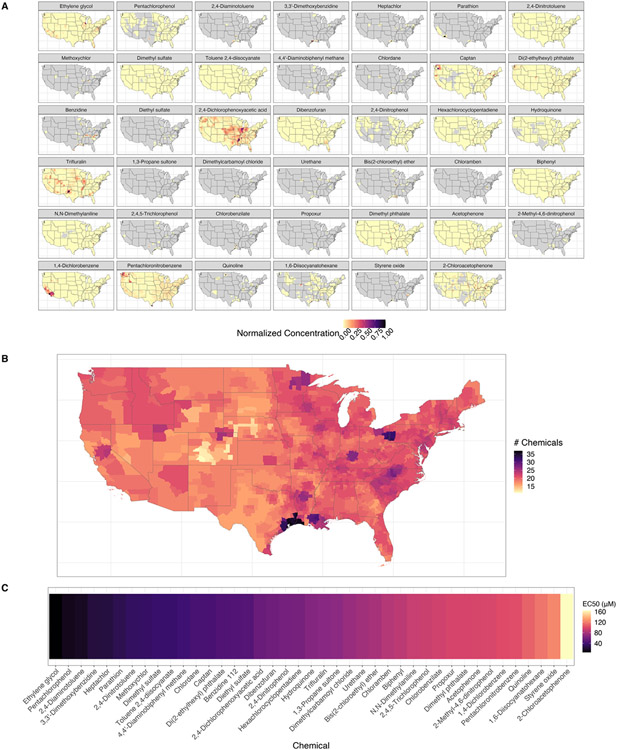
Fig. 2.
(A) Map of contaminant distributions for individual chemicals. Values are range scaled between zero and one to make chemicals of different magnitudes comparable. Black indicates higher environmental chemical concentrations in the air, and grey indicates counties where the chemical does not occur. The chemicals are ordered by the EC50. (B) The number of chemicals that co-occur in each county results in geospatially unique chemical mixtures. Here black indicates a higher number of chemicals present in the county that have positive hit calls for the CYP1A1 mRNA transcription assay. (C) The EC50 (the effective concentration at 50 % activity) for all chemicals is based on the refit 2-parameter Hill model. The black colour indicates lower EC50 values, which indicates a more potent chemical.

