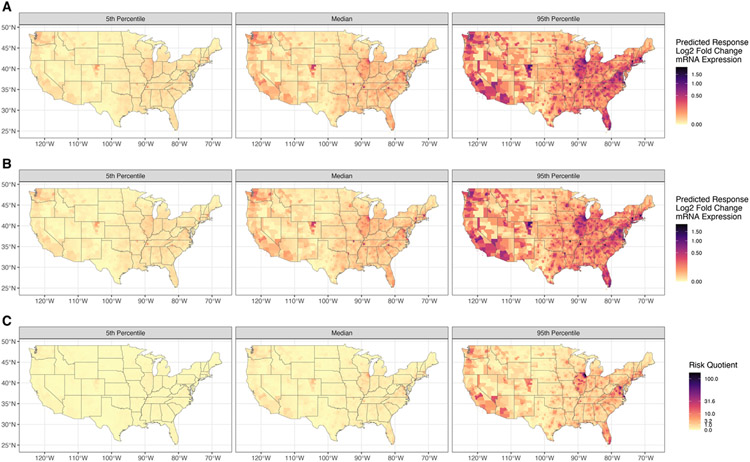
Fig. 3.
The predicted 5th, 50th (median), and 95th percentiles of predicted risk of increased mRNA expression of CYP1A1 using (A) Concentration Addition, (B) Independent Action, and (C) Risk Quotient using the 10 % effective concentration (EC10). In these figures, yellow indicates lower risk, and black indicates higher risk.

