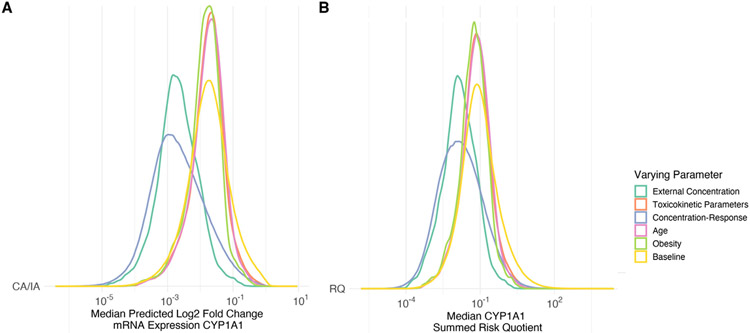
Fig. 4.
Probability density functions of the predicted risk of increased mRNA expression of CYP1A1 using (A) Concentration Addition (CA)/Independent Action (IA) and (B) The sum of the Risk Quotients (RQ) using the 10 % effective concentration (EC10) under different Monte Carlo uncertainty assessment. The varying parameter is allowed to vary while all other parameters are held constant using the median value. The yellow histogram is the baseline where all parameters are allowed to vary.

