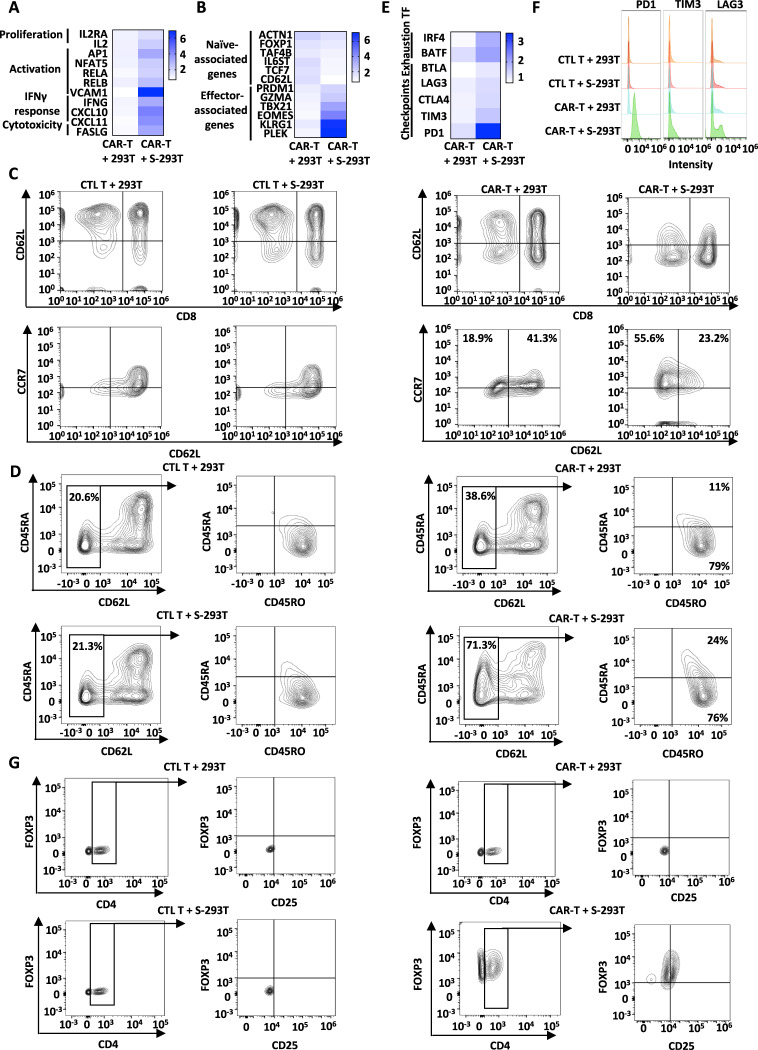
Fig. 2.
Phenotypical characterization of SARS-CoV-2-S CAR-T cells upon antigen stimulation. SARS-CoV-2-S CAR-T cells were incubated with 293 T or S-293T cells at a ratio of 3:1 for two days, and T cells in suspension were separated from adherent 293 T cells and collected, followed by RNA extraction and RT‒qPCR analysis to examine the expression of representative genes associated with T-cell proliferation, activation, IFNγ response and cytotoxicity (A), naive and effector T-cell gene signatures (B), and check points and transcription factors (E). The significance test is shown in Fig. S2 (*P < 0.05; **P < 0.01; ***P < 0.001). C CTL T or SARS-CoV-2-S CAR-T cells were incubated with or without 293 T or S-293T cells at a ratio of 3:1 for two days, and T cells in suspension were separated from adherent 293 T cells and stained with an anti-CD8 antibody conjugated with APC (CD8-APC), an anti-CD62L antibody conjugated with PE (CD62L-PE), and an anti-CCR7 antibody conjugated with FITC (CCR7-FITC) followed by flow cytometry analysis. D CAR-T cells as described in A were subjected to staining with an anti-CD45RA antibody conjugated with APC (CD45RA-APC), an anti-CD45RO antibody conjugated with FITC (CD45RO-FITC), and an anti-CD62L antibody conjugated with PE (CD62L-PE). Coexpression of CD62L and CD45RA was analyzed by flow cytometry. The expression of CD45RO and CD45RA was further measured on gated CD62L-negative cells. F CAR-T cells as described in A were subjected to staining with an anti-PD1 antibody conjugated with FITC (PD1-FITC), an anti-TIM3 antibody conjugated with APC (TIM3-APC) and an anti-LAG3 antibody conjugated with PE (LAG3-PE) followed by flow cytometry analysis. G CAR-T cells as described in A were subjected to staining with an anti-CD25 antibody conjugated with APC (CD25-APC), an anti-CD4 antibody conjugated with PE (CD4-PE) and an anti-FOXP3 antibody conjugated with Alexa Fluor® 488 (FOXP3-488). Coexpression of CD4 and FOXP3 was analyzed by flow cytometry. The expression of CD25 and FOXP3 was further measured on gated CD4-positive cells. All data are representative of three independent experiments

