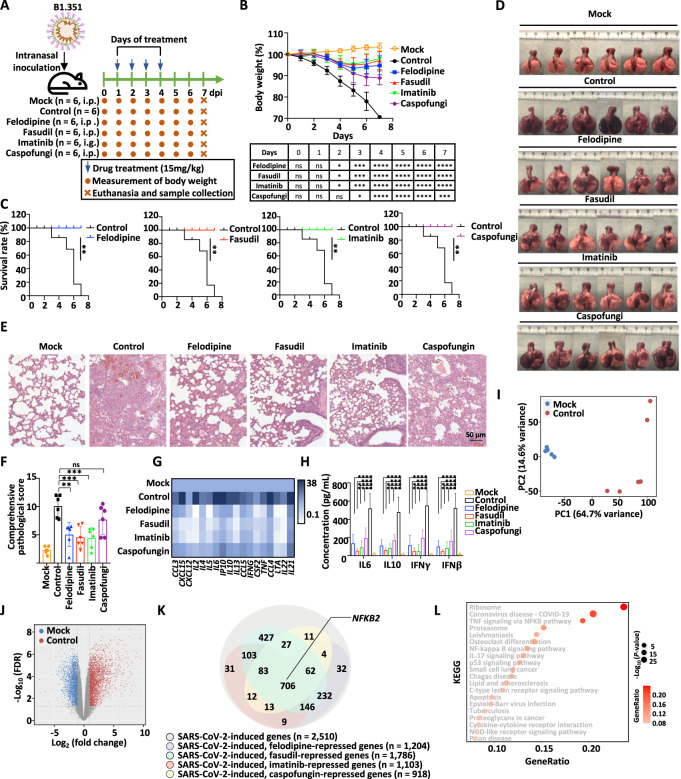
Fig. 5.
Felodipine, fasudil, imatinib, and caspofungin attenuate lethal inflammation, ameliorate severe pneumonia, and prevent mortality in SARS-CoV-2-infected Syrian hamsters. A Schematic representation of SARS-CoV-2 infection and drug treatment. Hamsters were intranasally inoculated with SARS-CoV-2 (1 × 10⁴ PFU) and then treated with or without felodipine (i.p.), fasudil (i.p.), imatinib (i.g.), or caspofungin (i.p.) on the indicated days (n = 6). Hamsters intranasally inoculated with SARS-CoV-2 without treatment were used as controls. Body weight was measured daily. Animals were euthanized to collect tissue samples at Day 7 post infection for virological and histological analysis. B The body weight of hamsters in each group from Day 0 to 7 post infection is shown. Significance was calculated using two-way ANOVA and is shown in the table (*P < 0.05, **P < 0.01, ***P < 0.001, ****P < 0.0001, ns: nonsignificant). C The survival curve for hamsters in each group from Day 0 to 7 post infection is shown. Significance was calculated using the log-rank (Mantel‒Cox) test (**P < 0.01). D Gross images of lung tissues collected from hamsters at Day 7 post infection are shown. E Representative images after H&E staining for lung lobe sections in hamsters at Day 7 post infection are shown. Scale bars, 50 μm. F Comprehensive pathological scores based on the severity and percentage of injured areas for each lung lobe for lung sections shown in Fig. S3A are shown. Significance was calculated using one-way ANOVA (*P < 0.05, **P < 0.01, ***P < 0.001, ****P < 0.0001, ns: nonsignificant). G The expression of inflammatory genes in lung tissues collected from hamsters at Day 7 post infection was detected by RT‒qPCR and represented by a heatmap. Data presented are the normalized value to the mock group after normalization to the expression of β-actin. The significance test is shown in Fig. S3B (*P < 0.05; **P < 0.01; ***P < 0.001). H The levels of cytokines, including IL6, IL10, IFNγ, and IFNβ in the lung tissues collected from hamsters at Day 7 post infection were measured by ELISA. Significance was calculated using one-way ANOVA (*P < 0.05, **P < 0.01, ***P < 0.001, ****P < 0.0001). I RNA was extracted from the lungs of hamsters as described in A at Day 7 post infection followed by RNA-seq analysis. The similarity in the gene expression profile for the mock and SARS-CoV-2-infected groups is shown by a PCA plot. J Genes regulated by SARS-CoV-2 infection are shown in a volcano plot. Blue and red dots represent down- and upregulated genes, respectively (FDR < 0.01, FC > 1.5). K Genes that were upregulated by SARS-CoV-2 infection as shown in J but repressed by felodipine, fasudil, imatinib, and caspofungin are shown in a Venn diagram. L KEGG analysis for those 706 genes that were upregulated by SARS-CoV-2 infection but commonly suppressed by felodipine, fasudil, imatinib, and caspofungin as described in K is shown

