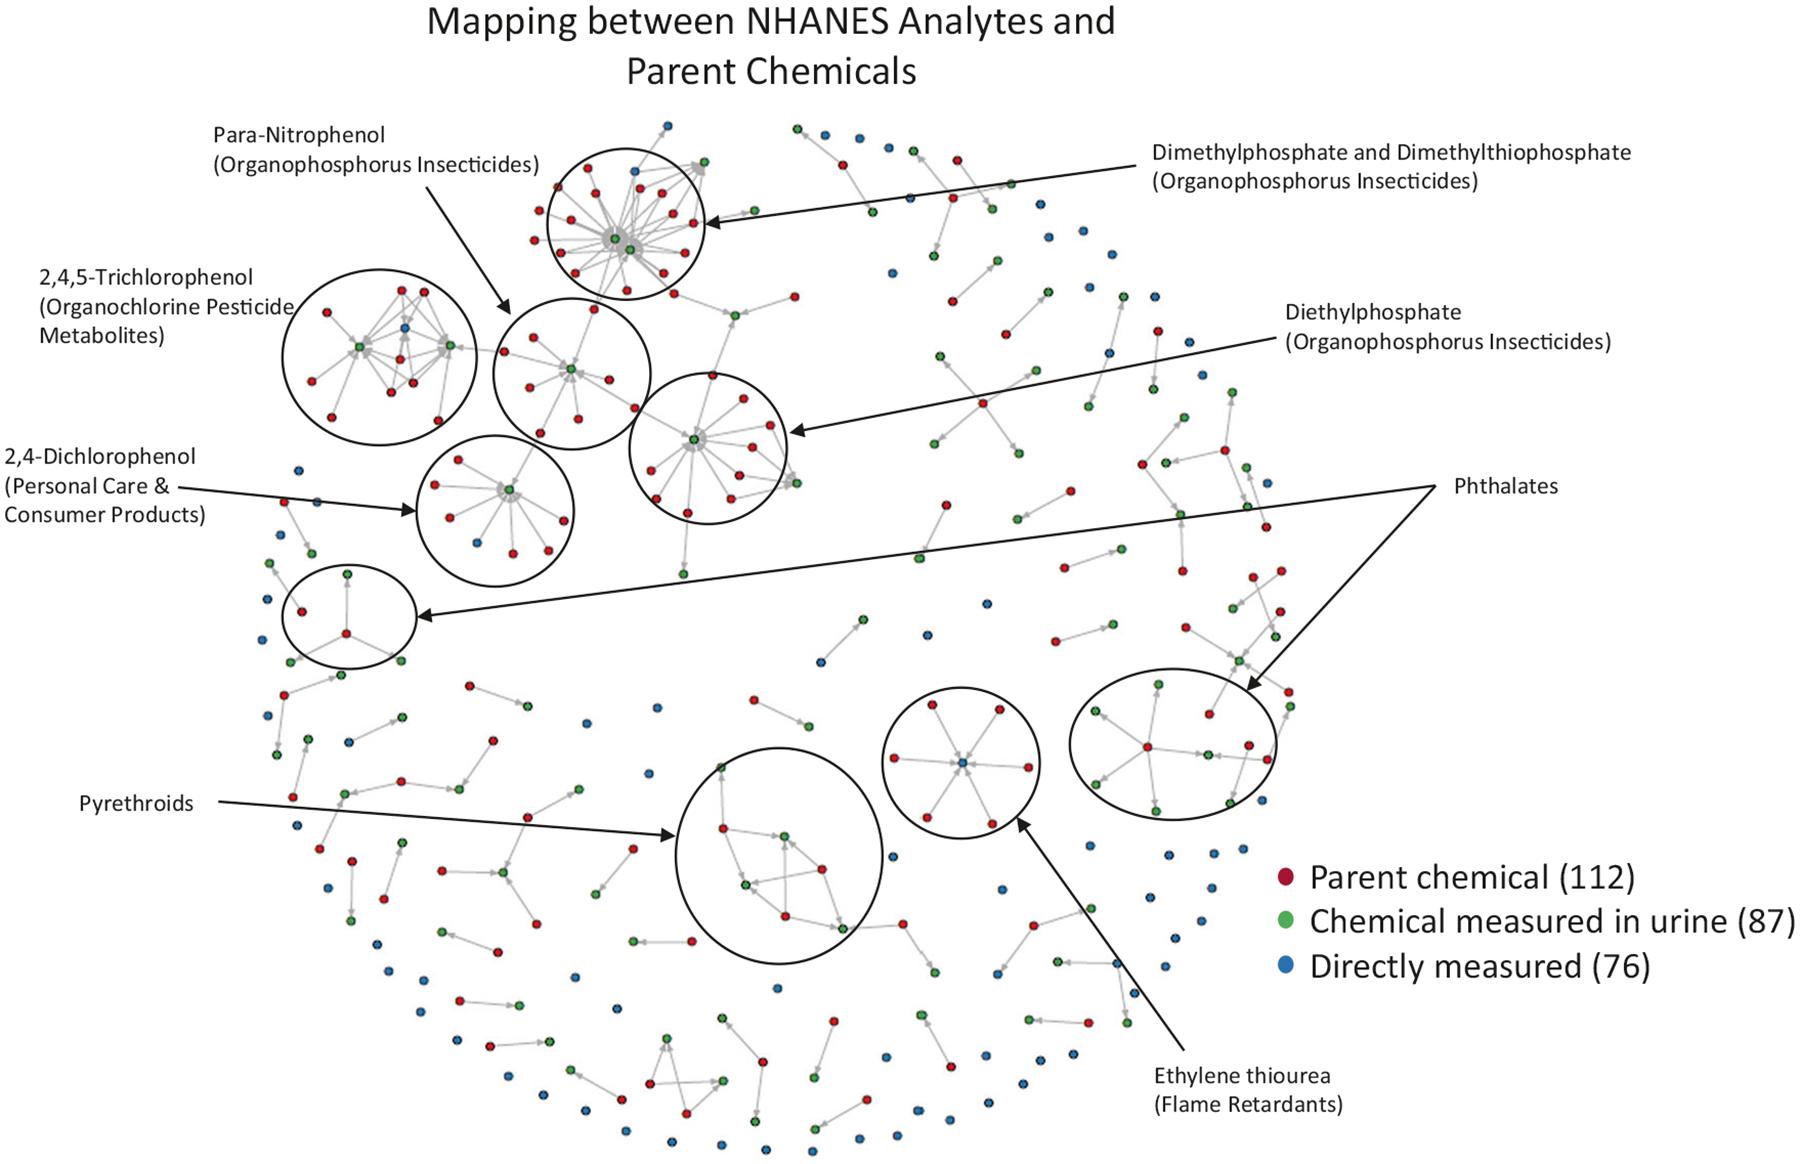
Fig. 2. Network representation of the parent-metabolite mapping for all NHANES metabolites.

Parent chemicals were identified using the NHANES reports and text mining of PubMed abstracts based on metabolite synonyms and keywords such as “metabolism” or “metabolite”. Nodes are either exclusively a parent chemical (red), exclusively a metabolite (green), or a chemical that was directly measured in urine (blue). For chemicals in this latter set, they are chemicals for which we wished to report an exposure inference and could be a “metabolite” according to NHANES but also have known metabolites (for example, about a dozen of these are metals). Links (edges) are directed in the direction of metabolism (in other words, parent -> metabolite). Denser areas of the graph are annotated by chemical class, which was also obtained from the NHANES reports.
