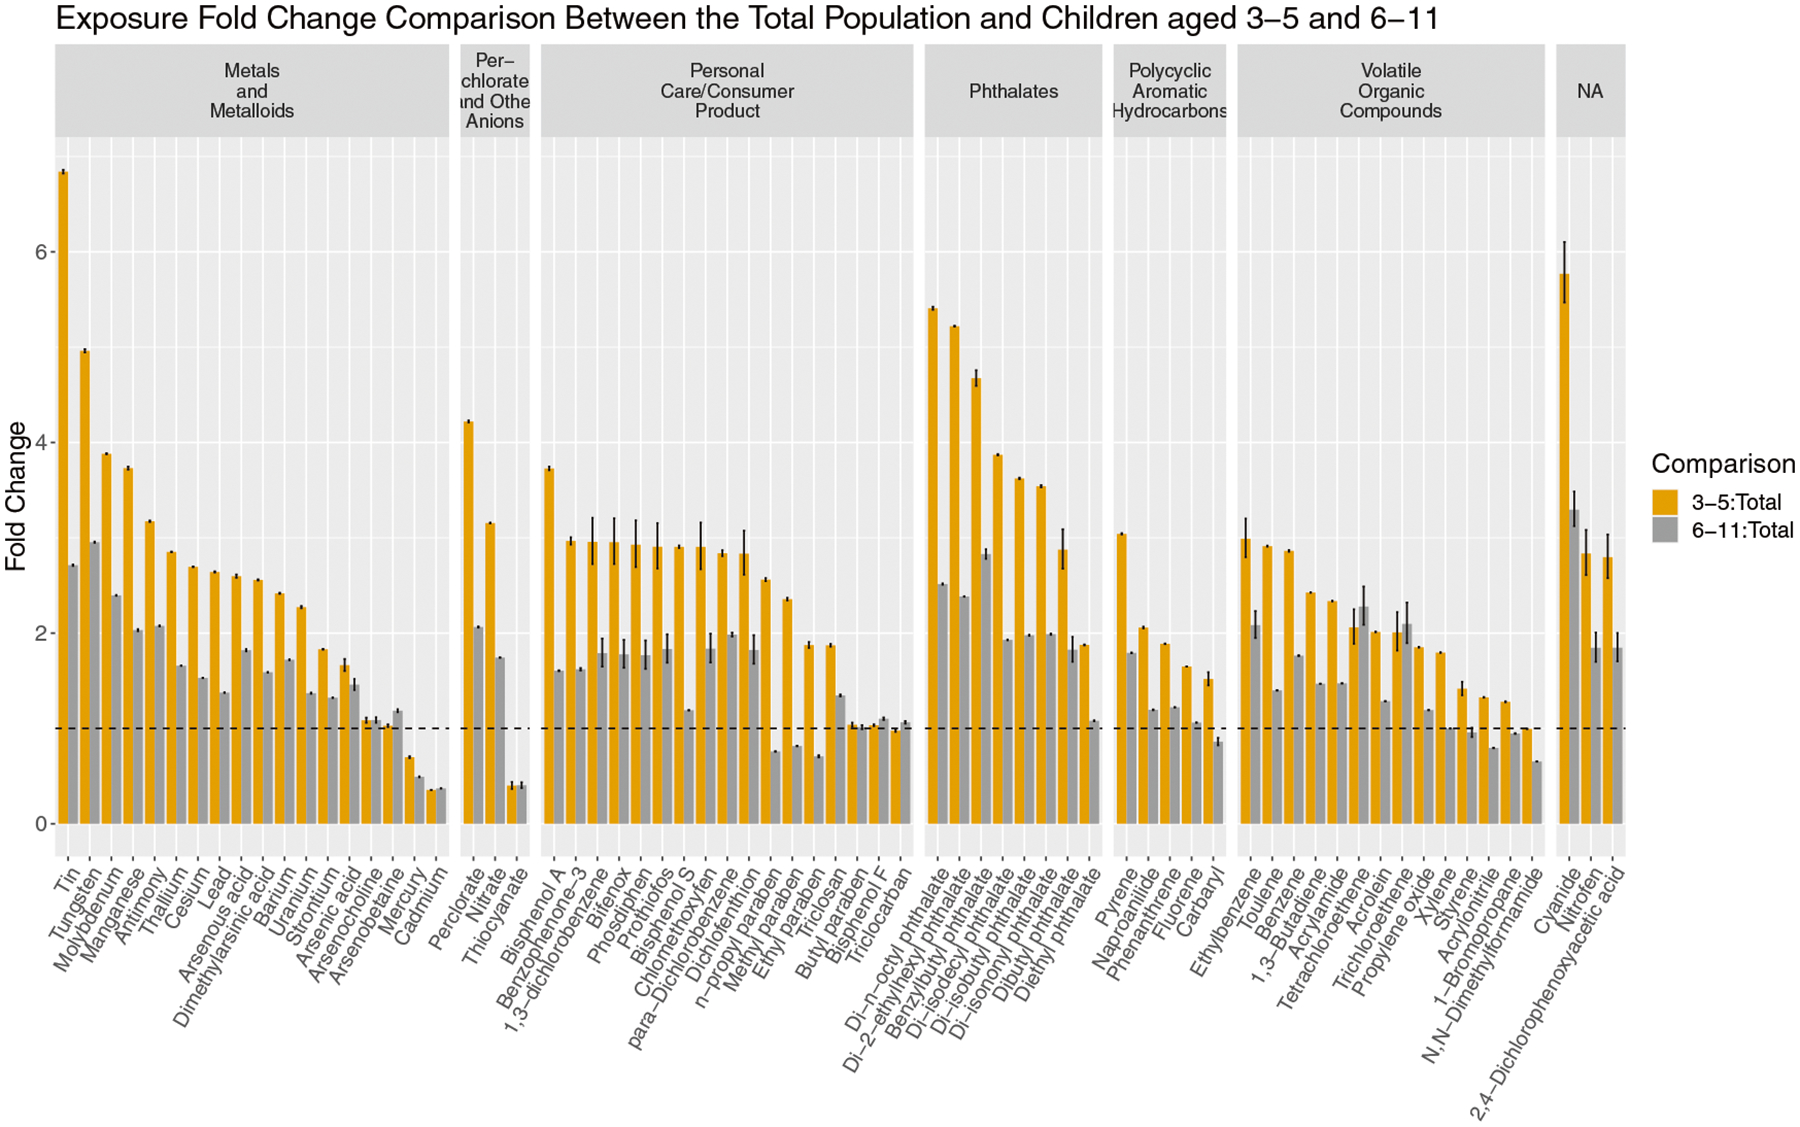
Fig. 5. Comparison of estimated intake rates of the new population group, 3–5-year-olds, introduced in the 2015–2016 NHANES cohort with 6–11-year-olds and all participants (labeled “Total”).

Bars represent the median exposure fold change between 3–5-year-olds and all NHANES participants (in gold) and between 6–11-year-olds and the total population (in gray). The error bars represent the 95% CI on the fold change between median exposure estimates. The dotted line indicates a fold change of 1 (in other words, no change in exposure) and chemicals are grouped by their chemical class as reported by NHANES.
