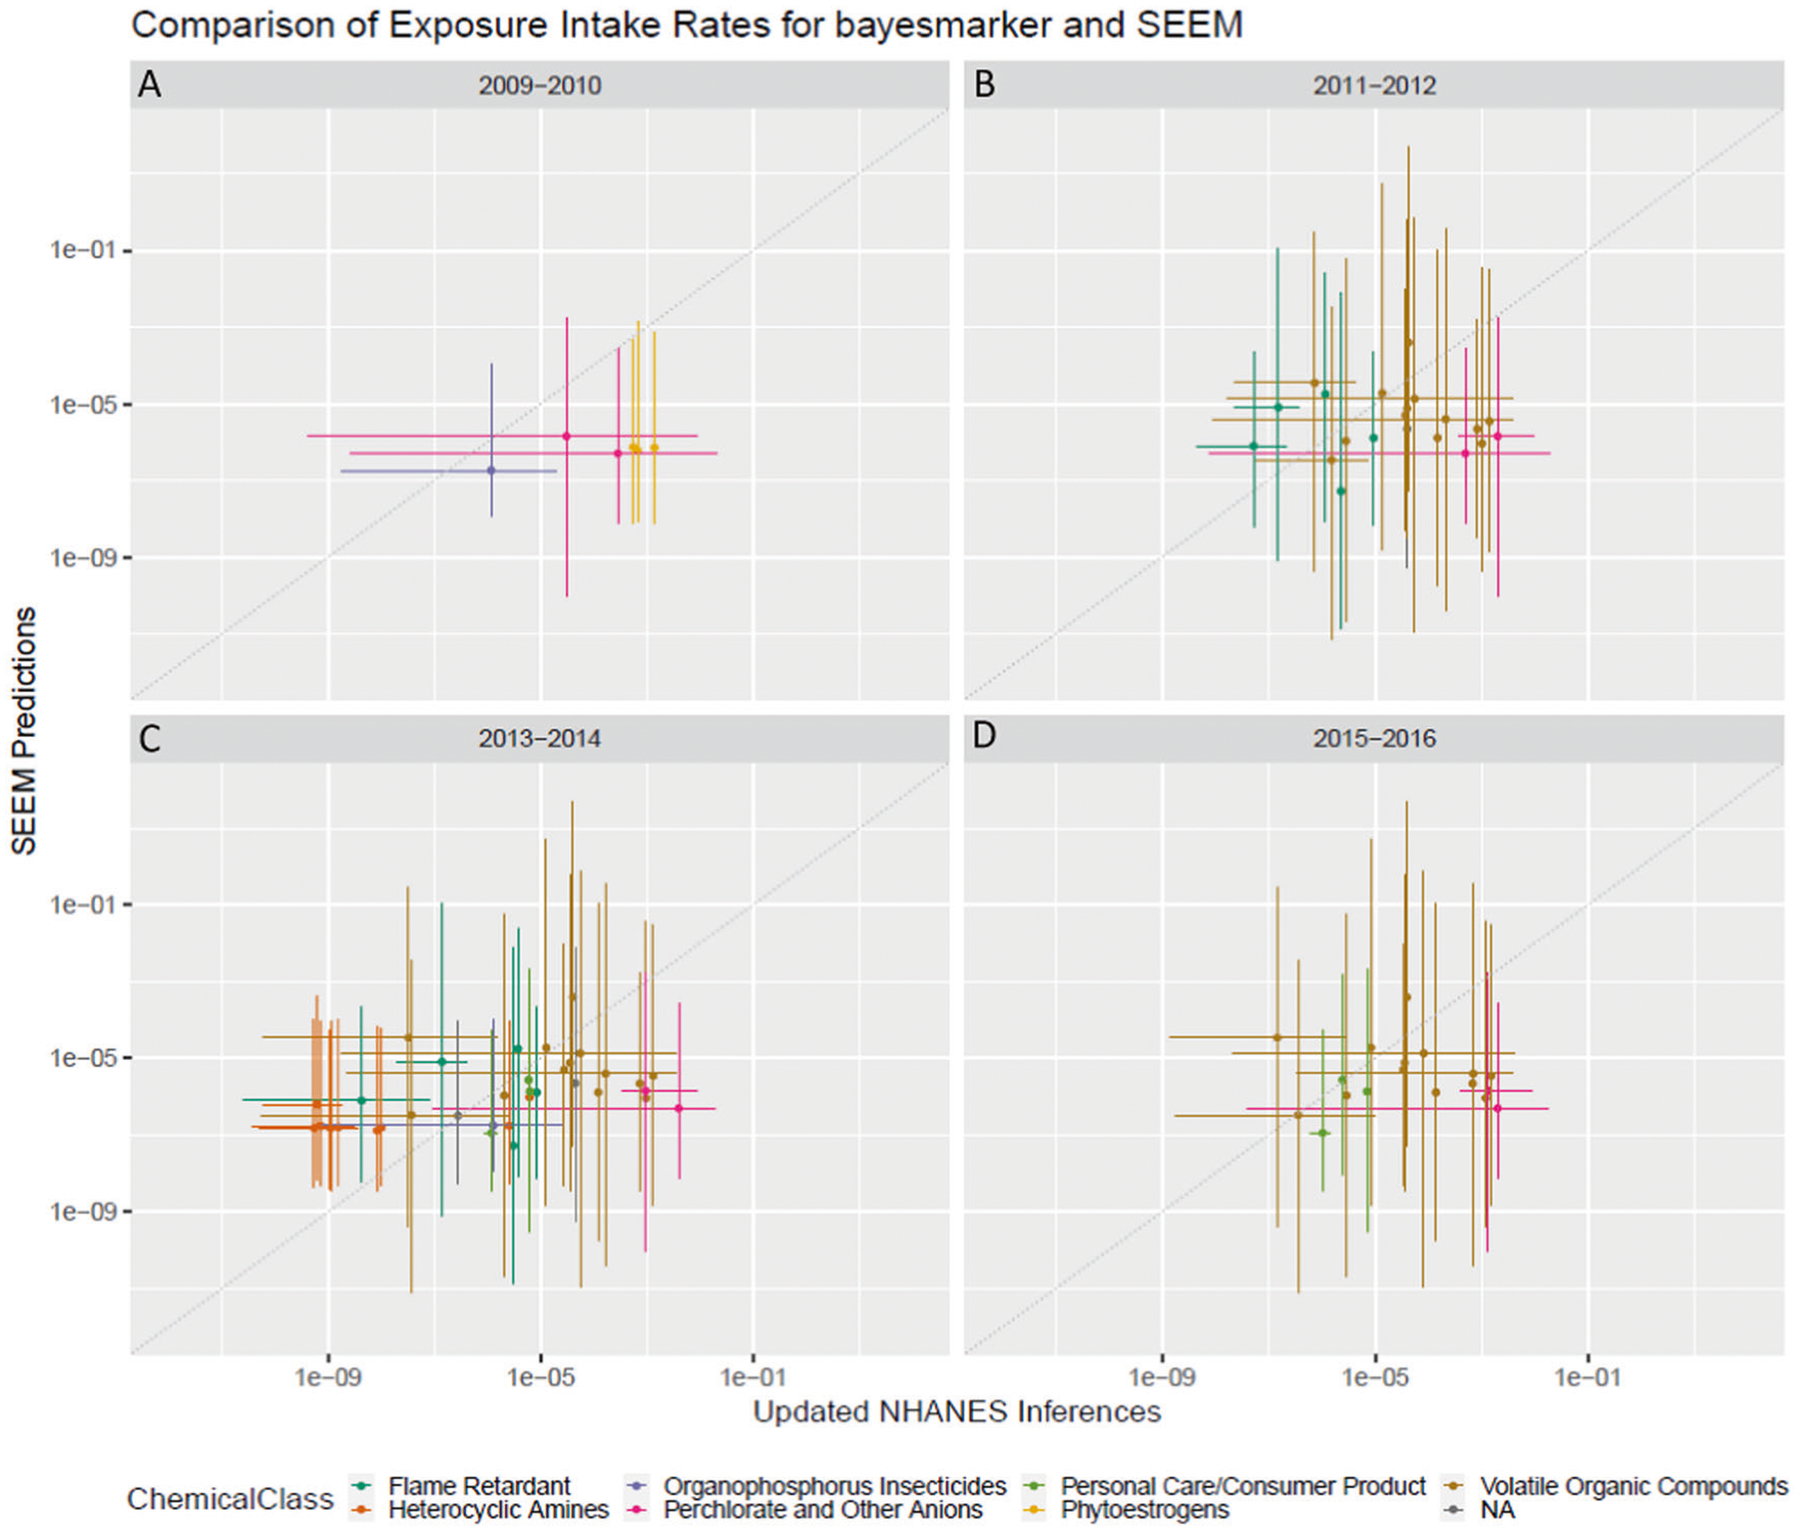
Fig. 6. Comparison of bayesmarker estimated intake rates with SEEM predictions for chemicals not in the SEEM calibration set.

SEEM predictions were originally calibrated using the 106 chemical exposure inferences from Wambaugh et al 2013. Using bayesmarker with the latest NHANES cohorts resulted in parent chemical exposures for 39 new parents that had original SEEM predictions. The bayesmarker inferences were compared with SEEM predictions using all individuals (total population) for each new cohort: A 2009–2010, B. 2011–2012, C 2013–2014, and D 2015–2016. Each point is a parent chemical with color indicating chemical class and error bars (x for bayesmarker, y for SEEM) indicating 95% confidence intervals. The dotted gray line indicates exact correlation.
