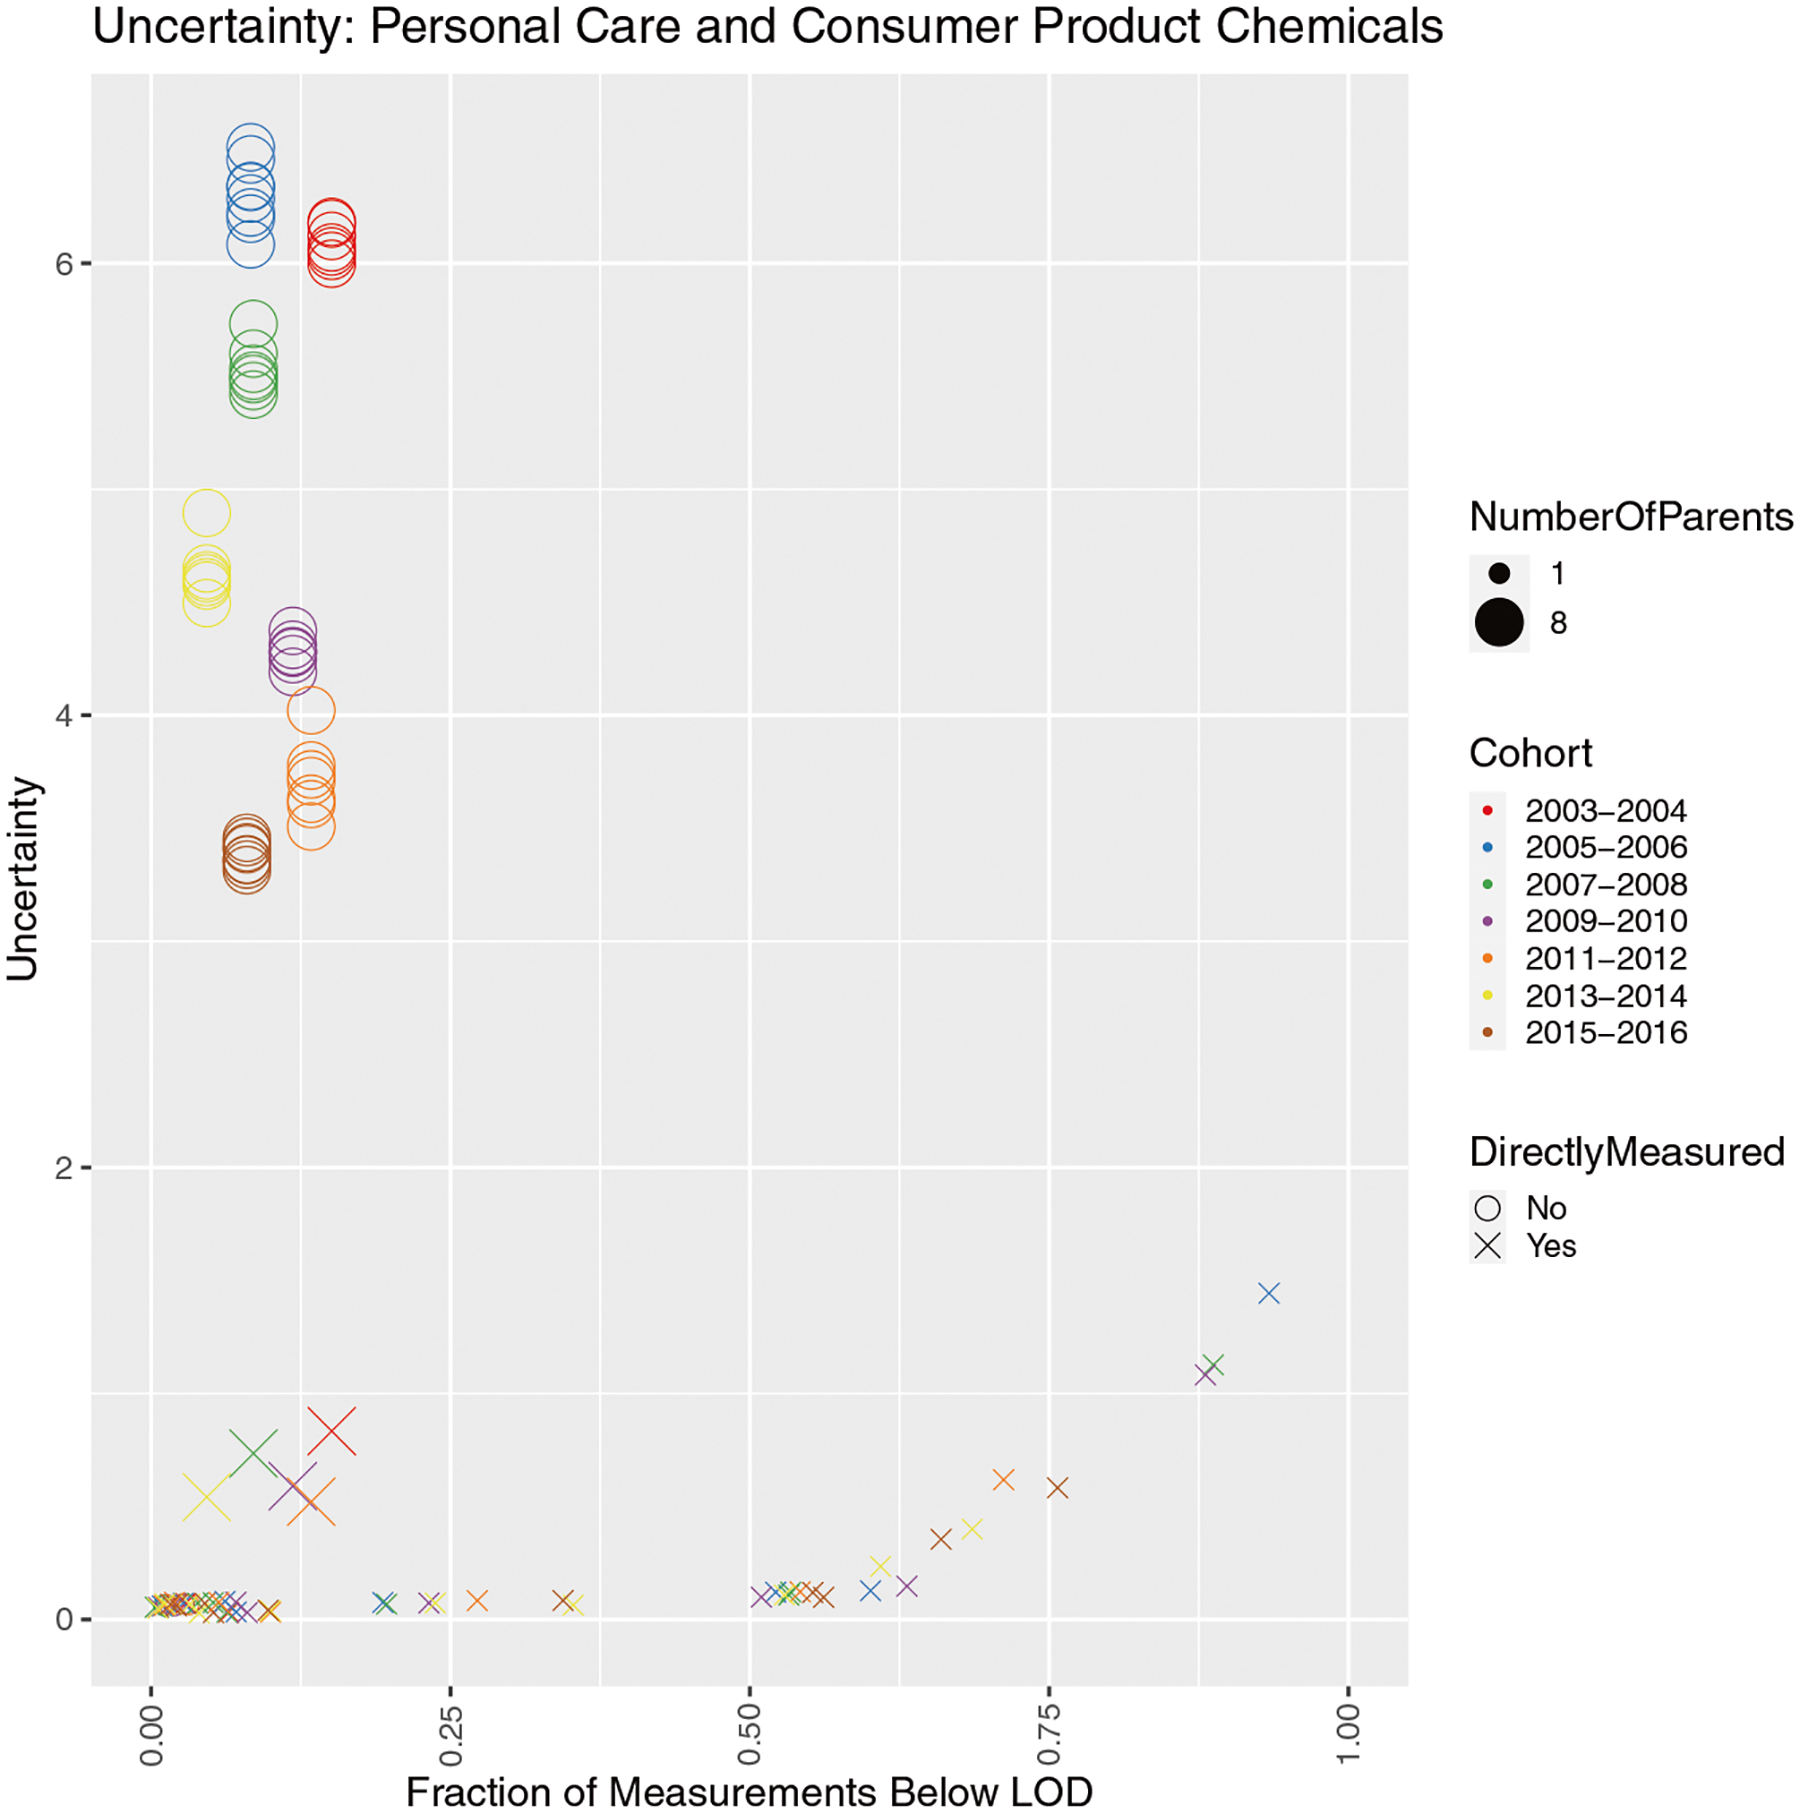
Fig. 7. Visualization of the influence of various potential contributors to uncertainty on inferred intake rates from urine biomonitoring data for personal care and consumer product chemicals.

Each data point represents a parent chemical in a single NHANES cohort for each of its metabolites measured in that cohort (so all unique parent-cohort-metabolite triplets). Uncertainty (on the y-axis) is the order of magnitude spanned by the 95% credible interval around the median estimated intake rate (in other words, log10(upper 95% CI/lower 95% CI) = uncertainty), and the fraction below the LOD (on the x-axis) represents the number of measurements below the LOD divided by the total number of measurements for the relevant metabolite. Chemicals are stratified by chemical class, points are colored by NHANES cohort, point size represents the number of parent chemicals shared by the relevant metabolite, and the point shape indicates whether or not a chemical was directly measured in NHANES (in other words, a urine concentration was obtained by NHANES for that parent chemical).
