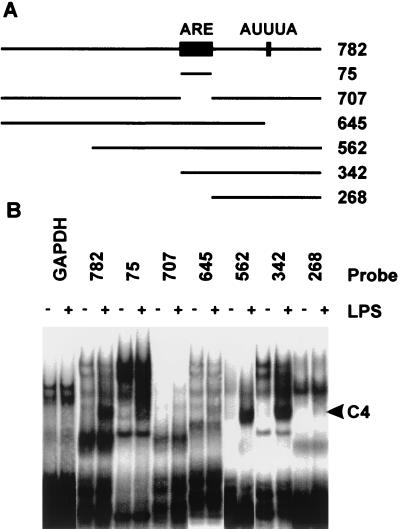
FIG. 2.
Mapping of protein interactions with the TNF-α 3′ UTR. (A) Schematic of truncated TNF-α 3′UTR probes. (B) Results for EMSAs in which 20 fmol of each probe was used with 10 μg of cytoplasmic extract prepared from untreated RAW264.7 cells (−) or from cells stimulated for 2 h with 10 ng of LPS per ml (+).

