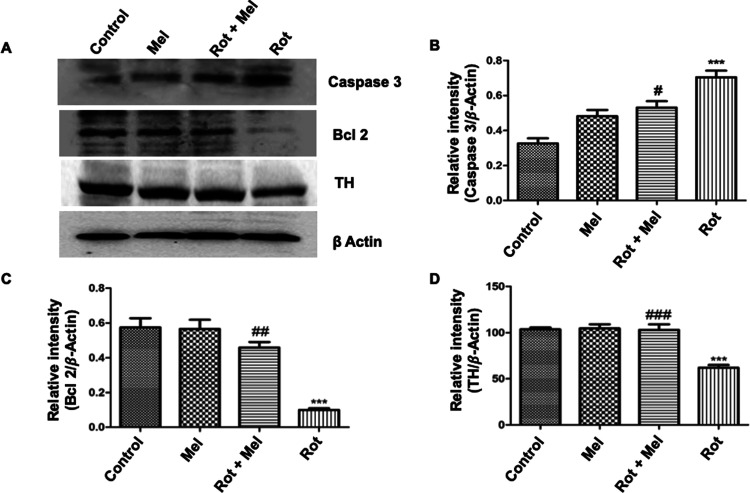
Figure 5.
Effect of melatonin on expression of caspase 3, Bcl 2, and TH. (A) Representative immunoblots showing expression of caspase 3, Bcl 2, and TH in different groups. (B–D) Relative densitometry data of caspase 3, Bcl 2, and TH analyzed and normalized with β-actin. ***P < 0.001 vs unexposed group, #P < 0.05, ##P < 0.01, and ###P < 0.001 vs rotenone-exposed group. One-way ANOVA was used to examine differences between the groups, with Tukey’s multiple-comparison test used to examine posthoc pairwise differences. The data is represented as the mean ± SEM of three independent experiments (Mel, melatonin; Rot, rotenone).

