Fig. 2.
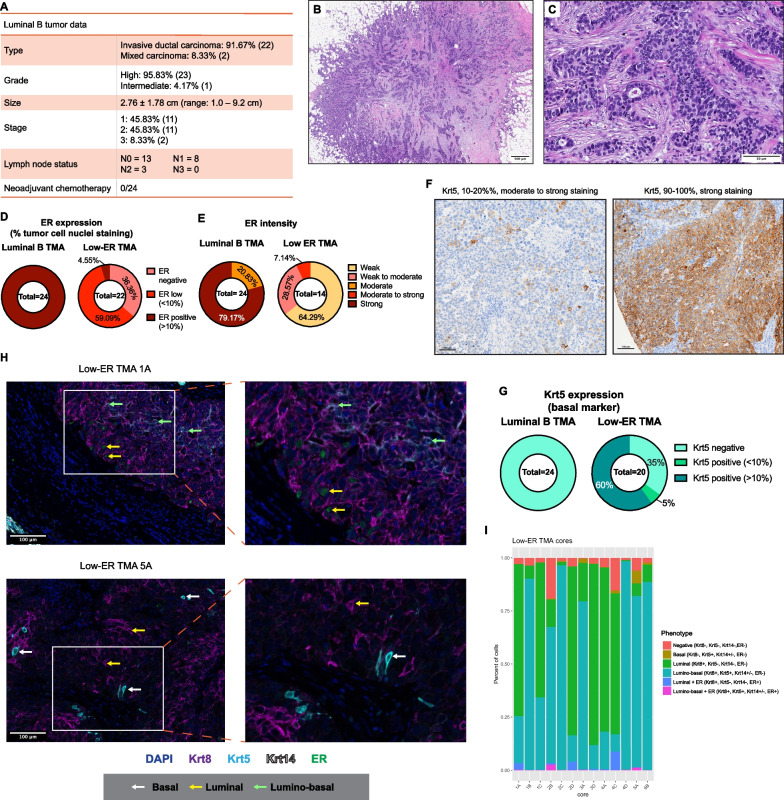
Low-ER tumors are distinct from luminal B tumors. A Details of the luminal B tumors included in TMAs as a comparison to Low-ER tumors. B, C H&E staining showing typical features of a luminal B tumor (high-grade invasive ductal carcinoma ER+ (> 90%) PR+ (30%) HER2- high Ki67 tumor). B Lower power image showing a poorly differentiated carcinoma with irregular, infiltrative borders (1X H&E). C Tumor cells infiltrating as small solid nests with scattered tubule formation within a desmoplastic stroma. Note the lack of necrosis, solid growth, and a tumor associated lymphoplasmacytic infiltrate typically seen in breast carcinomas with basal-like characteristics (20X H&E). D, E ER expression (D) and intensity (E) levels of the luminal B tumors. F Representative images of Krt5 IHC staining in low-ER TMAs. G Quantified Krt5 expression in luminal B and low-ER TMAs. H Representative images of TSA staining containing heterogeneous populations in low-ER TMAs. Samples were stained with Krt8 (purple), Krt5 (cyan), Krt14 (white), ER (green), and DAPI (blue). White arrows point to basal tumor cells, yellow arrows point to luminal tumor cells, and green arrows point to lumino-basal tumor cells. I Quantification of different cell phenotypes found within 13 of the low-ER TMA cores which were found to harbor heterogeneous populations (TMA cores with homogenous populations were excluded)

