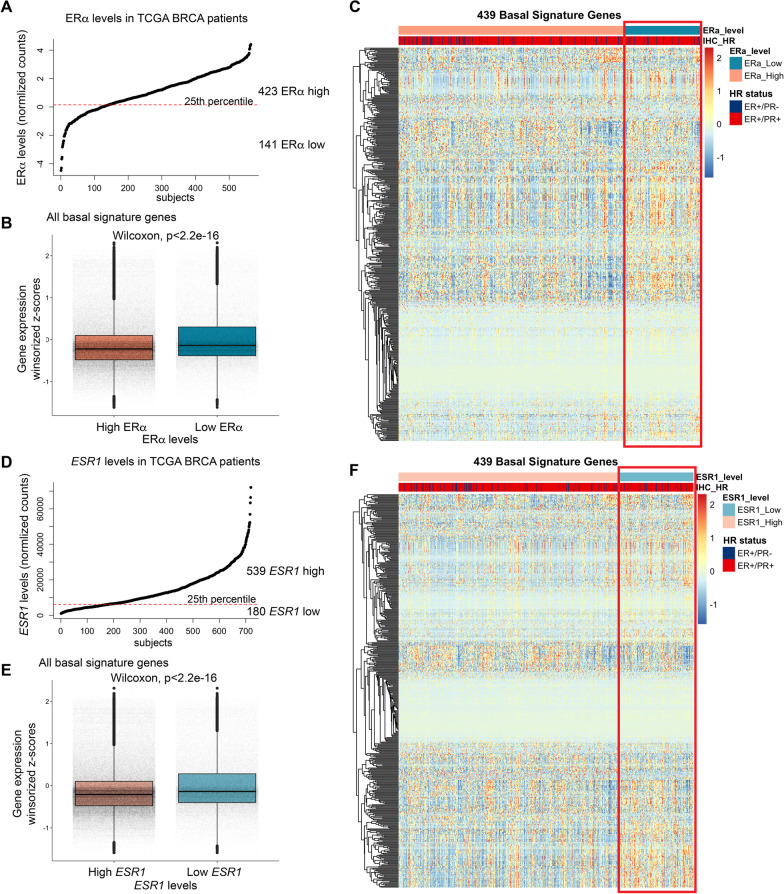
Fig. 3.
Distinct basal gene expression signature in tumors with lower ER. A Stratification of ER-positive breast tumor cases from TCGA into ERα low and ERα high groups, based on ERα expression. B Boxplots comparing the distribution of basal signature gene expression in the ERα low and ERα high groups. C Heatmap with supervised clustering of the ER-positive tumors highlighting higher basal signature gene expression in the ERα low group. D Stratification of ER-positive breast tumor cases from TCGA into ESR1 low and ESR1 high groups, based on ESR1 expression. E Boxplots comparing distribution of basal signature gene expression in the ESR1 low and ESR1 high groups. F Heatmap with supervised clustering of the ER-positive tumors highlighting higher basal signature gene expression in the ESR1 low group

