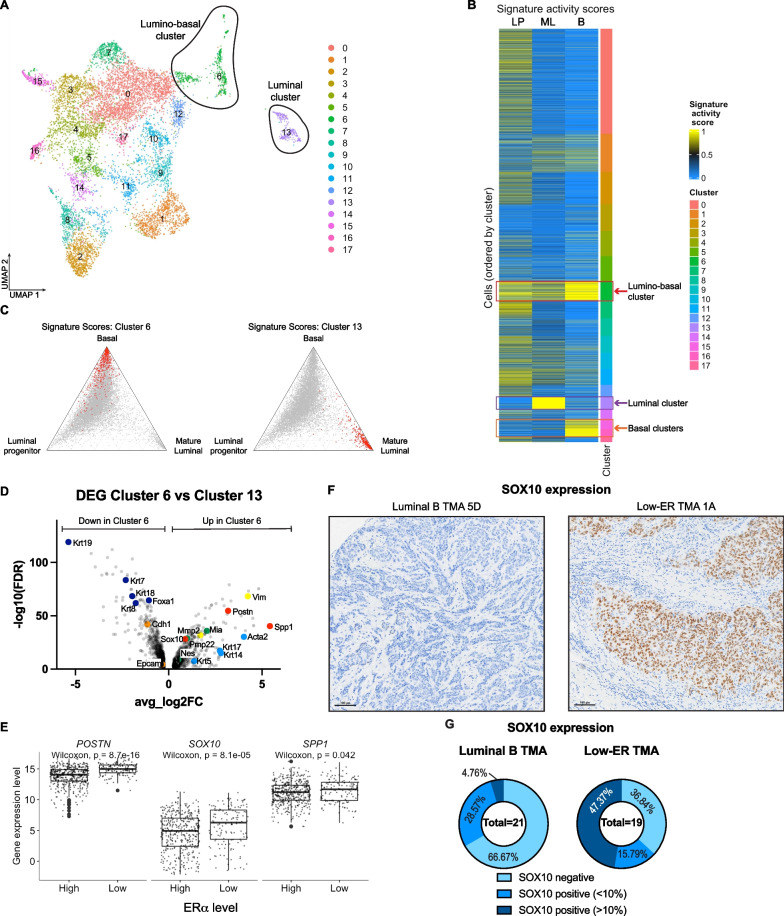
Fig. 5.
Sox10 is a potential driver of luminal-to-basal plasticity. A UMAP of Krt8-CreERT/Rosa26-mTmG/MMTV-PyMT tumor cells sorted for GFP. Unsupervised clustering divided the cells into 18 different clusters. B Heatmap showing the basal, mature luminal, and luminal progenitor gene signature activity in each cluster. Cluster 13 (purple box) has high expression of mature luminal genes, while clusters 15 and 16 (orange box) have high expression of basal genes. Cluster 6 (red box) has high expression of both mature luminal and basal genes, and is identified as the lumino-basal cluster. C Ternary plots showing the distribution of relative activity of luminal progenitor, mature luminal, and basal gene signatures across all tumor cells profiled by scRNA-seq. In the left plot, cells assigned to cluster 6 are highlighted in red, while cells assigned to cluster 13 are highlighted in the right plot. D Volcano plot showing genes upregulated and downregulated in cluster 6 as compared to cluster 13. Light blue points are basal marker genes, dark blue points are luminal marker genes, yellow points are mesenchymal genes, orange points are epithelial genes, red points are potential plasticity driver genes, and green points are SOX10 target genes. E Boxplots showing the differences in distribution of POSTN, SOX10, and SPP1 gene expression between the ERα low and ERα high groups of tumors obtained from TCGA. F Representative images of SOX10 IHC staining in luminal B and low-ER TMAs. G Quantified SOX10 expression in luminal B and low-ER TMAs

