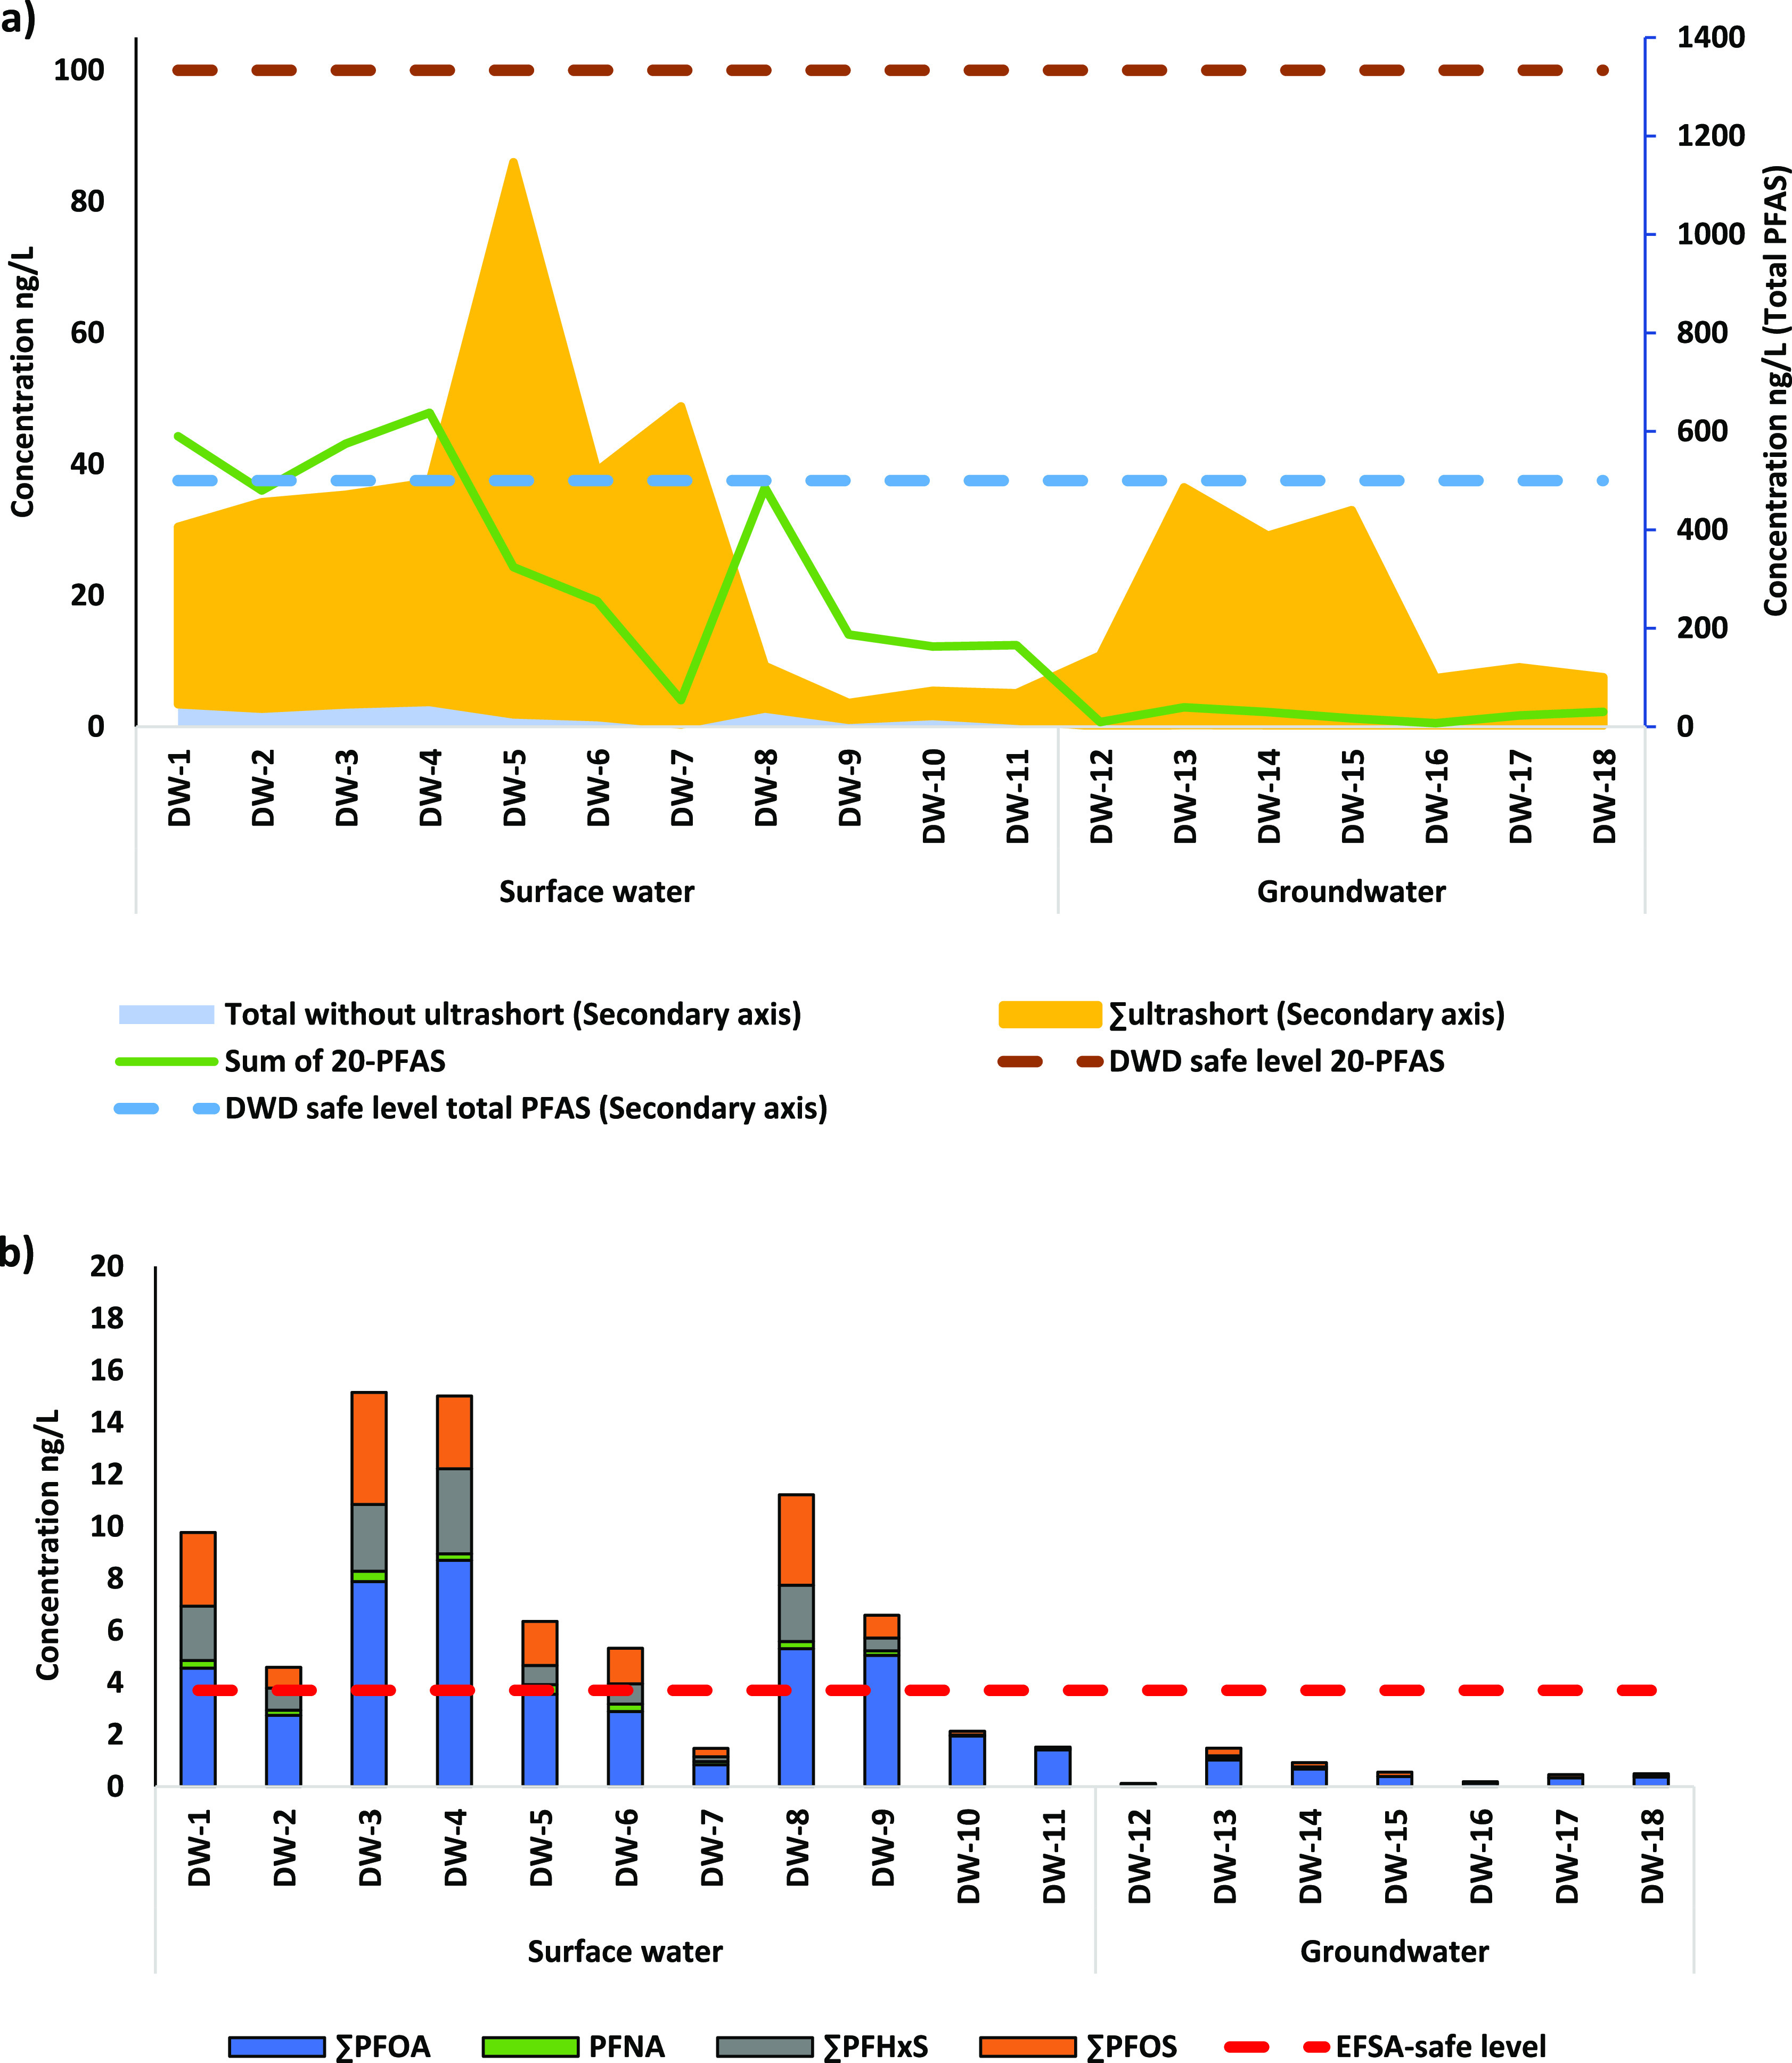
Figure 5.

Occurrence of PFAS as compared to (a) binding DWD guidelines and (b) non-binding preliminary quality guideline. The red (b), brown [primary y-axis on the left, (b)], and light-blue [secondary y-axis on the right, (b)] dashed lines represent the safe level based on the non-binding EFSA 2020 (4-PFAS), DWD (20-PFAS), and DWD total PFAS, respectively. The green line [primary axis, to be compared with the brown line, figure (a)], light blue, and yellow shadows [secondary axis, to be compared with the dashed blue line, (a)] present, respectively, the concentration of the sum of 20 DWD-PFAS, total investigated PFAS without the ultrashort chain, and the ultrashort chain PFAS.
