Figure 6.
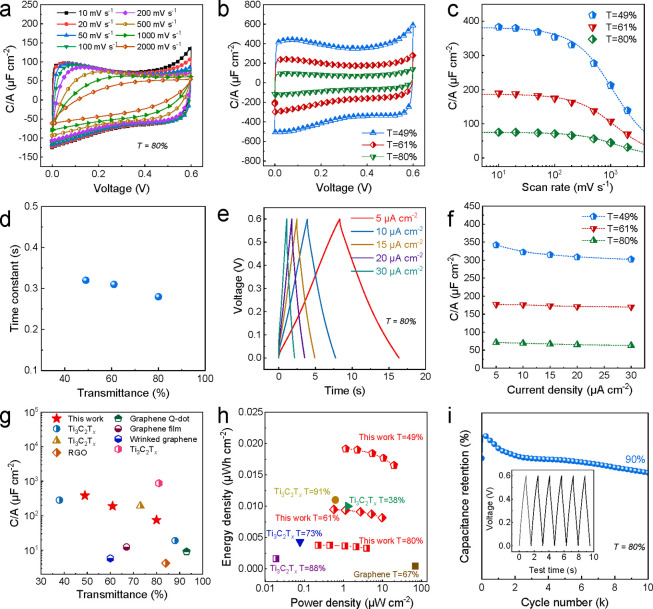
Electrochemical characterization of a transparent Ti3C2Tx MSC. (a) Normalized CV curves at various scan rates of the MSC device with T = 80%. (b) CV curves with different transparency at 10 mV s–1. (c) Measured areal capacitance obtained from CV curves. The dashed lines represent the capacitance fitting value according to eq 5. (d) The obtained time constant (Figure 6c), versus transmittance. (e) GCD curves at different current densities of devices, T = 80%. (f) Measured areal capacitance obtained from GCD curves of various transparency symmetric micro-supercapacitors. (g) Areal capacitance versus transmittance and comparison to other transparent supercapacitors. Detailed values are presented in Table S5. (h) Ragone plots of symmetric supercapacitors using different transparent electrodes and comparison to other transparent supercapacitors. Detailed values are presented in Table S6. (i) Long-term cycling of the transparent micro-supercapacitor (T = 80%). Note, the transmittance of the electrode before laser engraving is defined as the transmittance of the MSC, while the transmittance of the interdigitated MSC after laser engraving is much higher than that of the electrode before engraving; furthermore the transmittance of the MSC depends on the interdigitated finger gap of the MSC.

