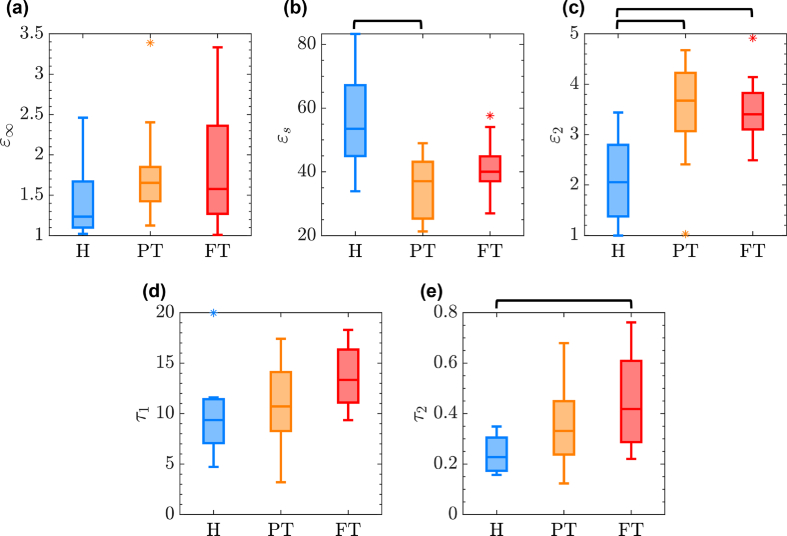
Fig. 5.
the distribution of five DD parameters including (a) , (b) , (c) , (d) , and (e) within each group over the entire sample set. The horizontal back lines over each sub-plot shows a statistically-significant (p<0.05) difference between any two groups using a specific parameter. For example, the horizontal line between H and PT groups in (b) means that the difference between the values of all samples in H and PT categories is statistically significant.

