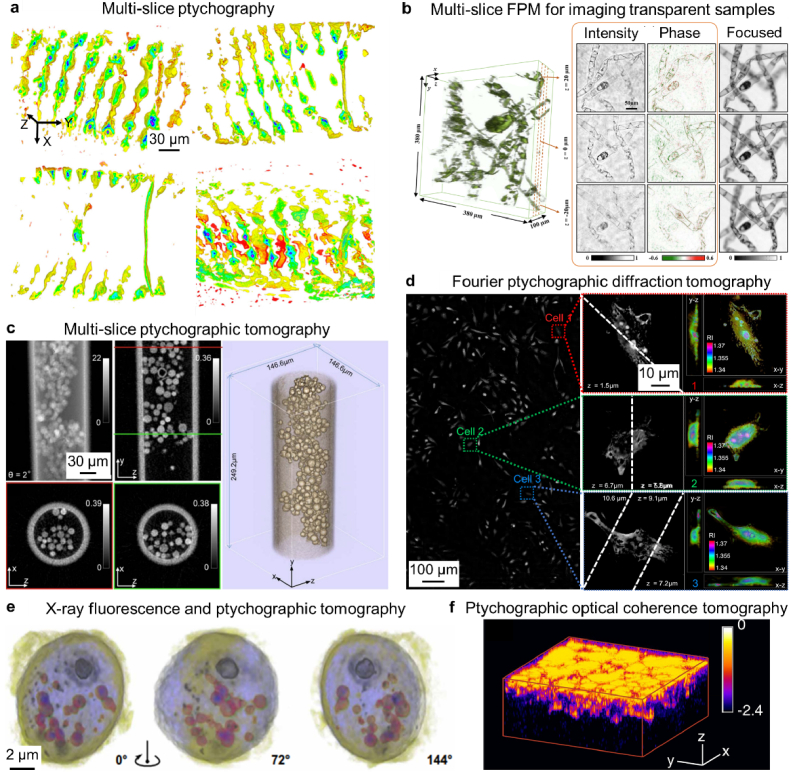
Fig. 10.
Ptychography for 3D microscopy. (a) The recovered 3D volume of a Spirogyra sample via multi-slice ptychography [15]. (b) The recovered intensity and phase images of a 3D Spirogyra algae sample based on multi-slice FPM [16]. (c) Phase projection and 3D rendering of a 3D sample using multi-slice ptychographic tomography [93]. (d) Wide-field-of-view and high-resolution 3D imaging of a large population of HeLa cells via Fourier ptychographic diffraction tomography [71], where 3D refractive index of the cell culture is recovered from the FPM intensity measurements. (e) Different projected views of X-ray fluorescence and ptychographic tomography reconstructions [52], where pyrenoid locates near the top region and acidocalcisomes near the bottom region. (f) 3D rendering of a reconstructed mouse brain using ptychographic optical coherence tomography [142]. The colorscale represents the logarithm of the normalized reflectivity.

