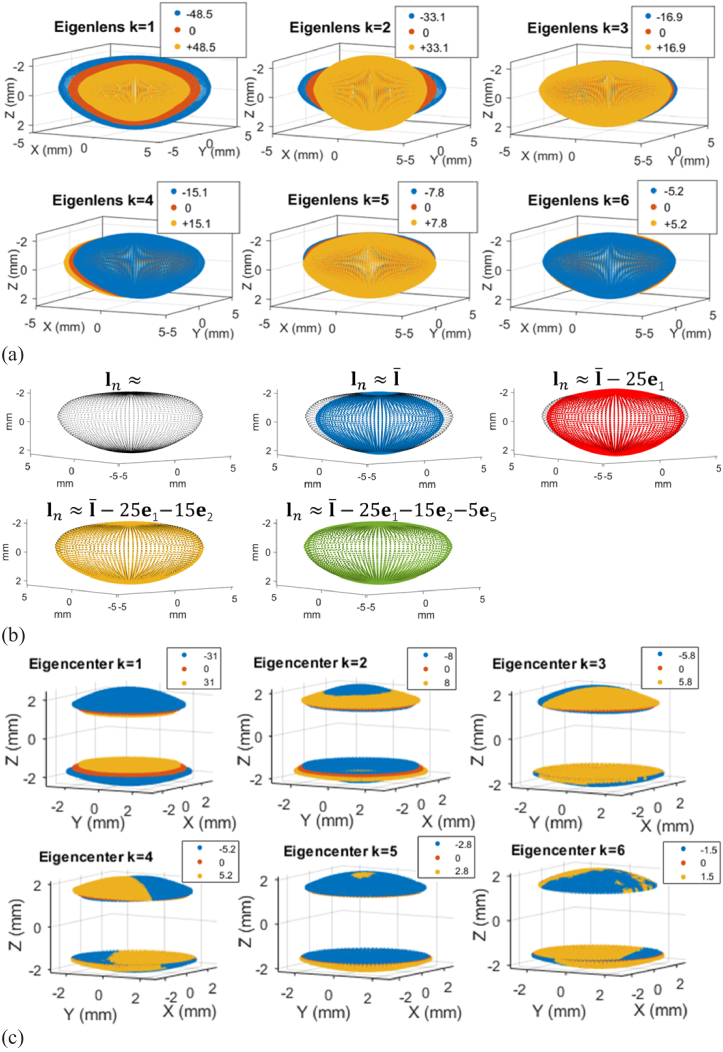
Fig. 1.
(a) Representation of the 6 first eigenlenses obtained, for each eigenlens k, as . Three different values are illustrated for every eigenlens k (in blue, red and yellow). The average lens is represented in all subfigures in red ( = 0) and the different eigenlenses can be interpreted as deformations from this average lens shape. (b) Example of how the representation of a given lens improves as more eigenlenses are included. The black lens shows the lens to be represented. Blue, red, yellow and green lenses show the obtained representation as the average lens , the , and coefficients are included, respectively. Asymmetric terms ( and ) are not included in the example for clarity. (c) Representation of the 6 first eigencenters obtained, for each eigencenter k, as . Three different values are illustrated for every eigencenter k (in blue, red and yellow). The average central area is represented in all subfigures in red ( = 0) and the different eigencenters can be interpreted as deformations from this average central area.

