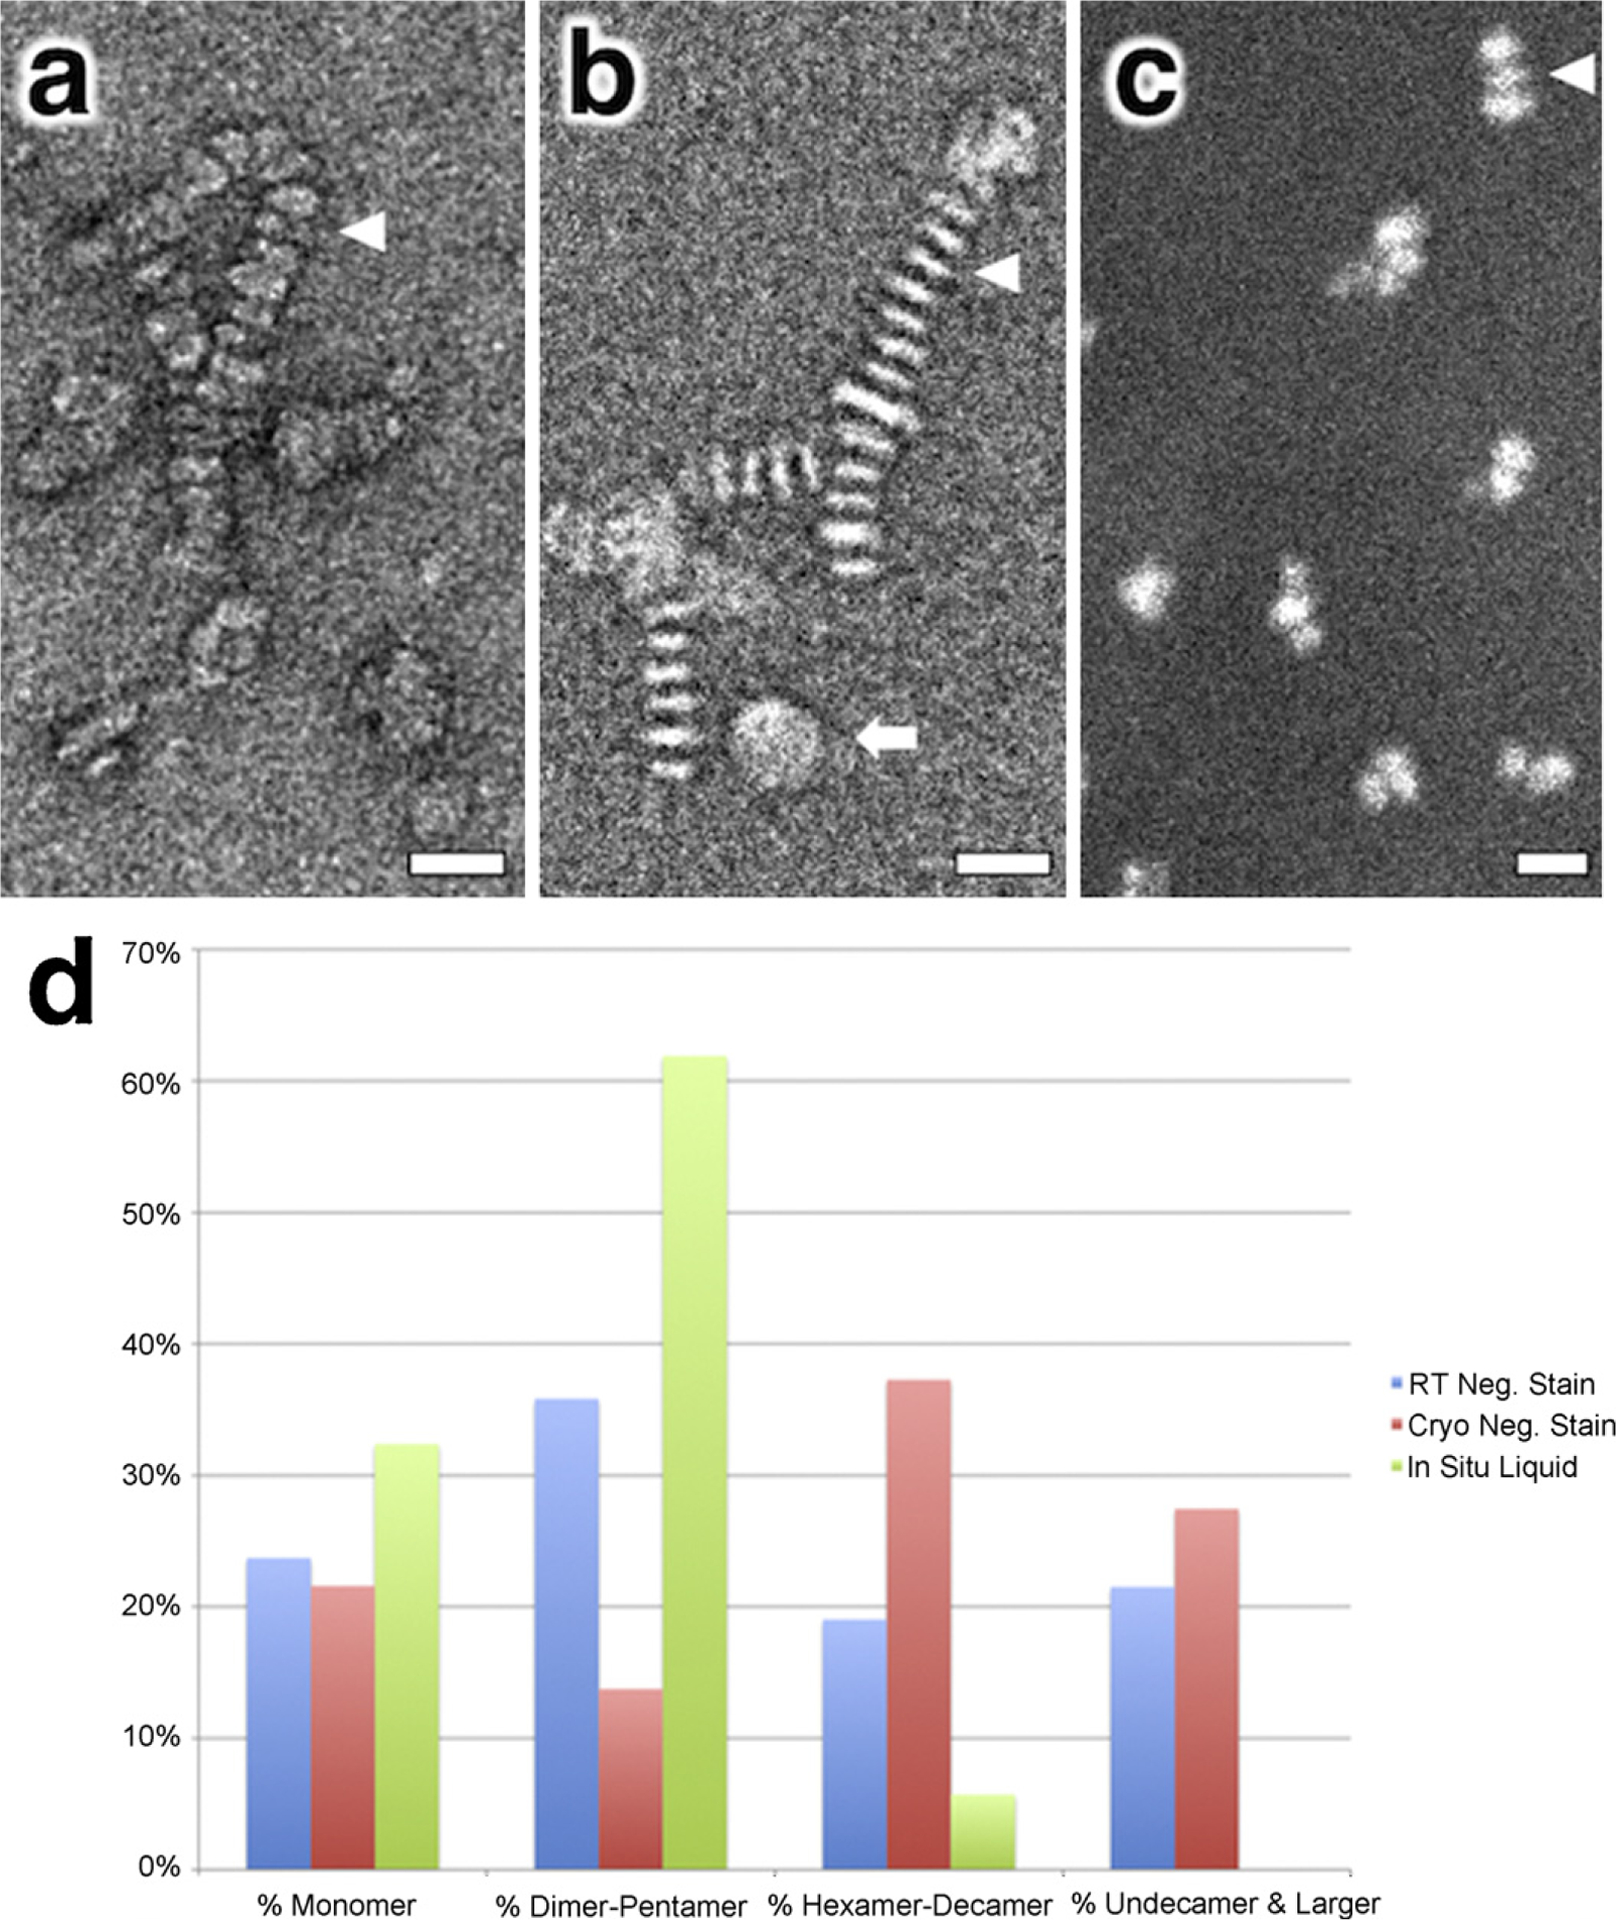
Fig. 3.

Analyzing nanolipoprotein disc (NLP) stacking with electron microscopy. (a and b) Conventional and cryogenic negative stain TEM images of nanolipoprotein discs indicating the presence of disc stacking. (c) In situ liquid dark field STEM image of NLPs fully hydrated and in suspension also depicting evidence of short stacking. (d) Histogram showing percentage of NLP population that appear as monomers or stacked oligomers of varying length. The white arrowheads in (a)–(c) point to individual NLPs in side view whereas the white arrow in (b) indicates a NLP in plan view. Note that the NLPs in (a) and (b) are arranged as long stacked chains whereas in (c) the NLPs are present in shorter stacks as dimers and trimers. Scale bars represent 20 nm.
