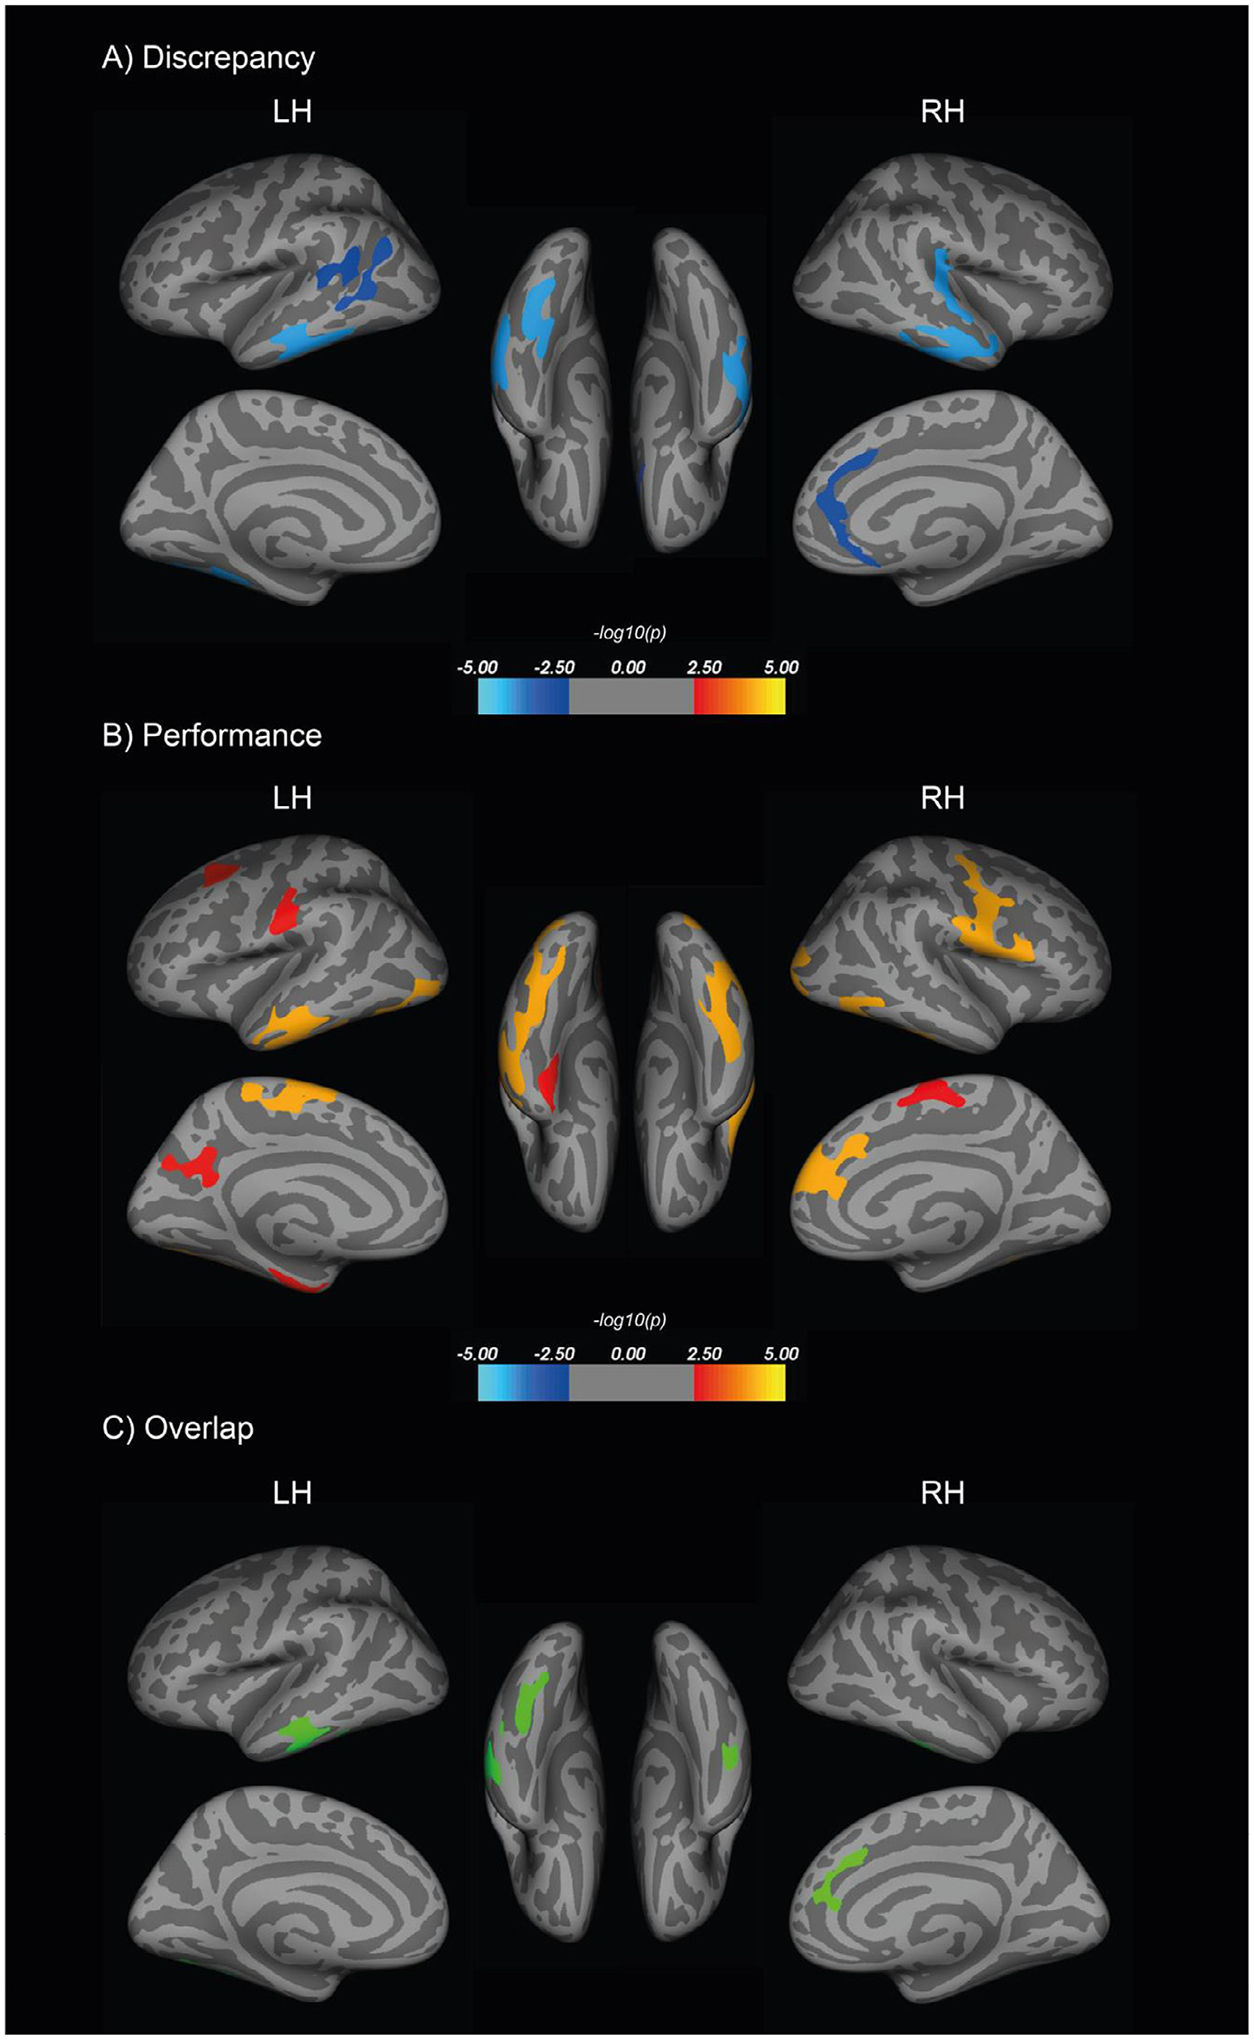
Fig. 2.

Vertex-wise whole brain analyses were conducted to examine the relationship between cortical thickness and (A) average appraisal discrepancy (overestimation correlated with thinner cortices) and (B) average objective performance, after adjusting for age, sex, education, and GDS (worse objective performance correlated with thinner cortices). The maps shown here used a liberal threshold of cluster-wise Monte Carlo simulation correction at p < 0.01. Overlapping regions are presented in (C). GDS, geriatric depression scale.
