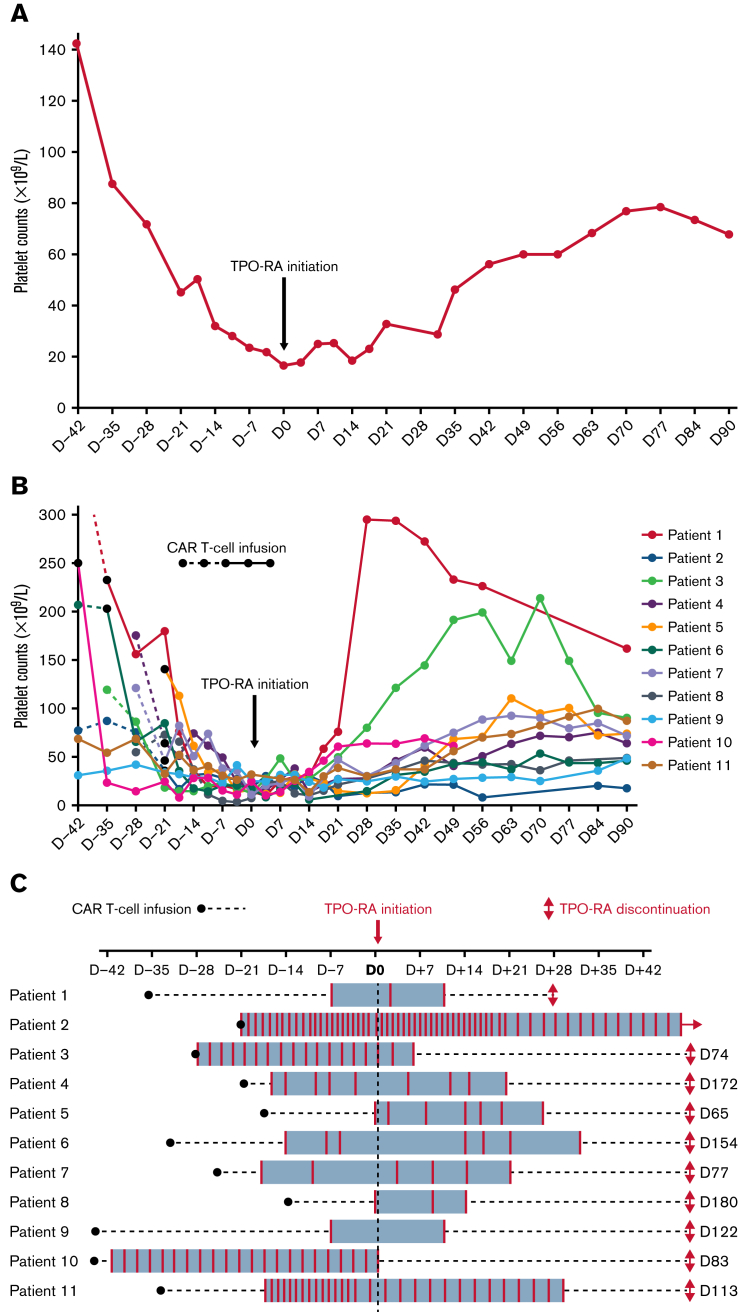
Figure 1.
Platelet counts and platelet transfusion rates before and after TPO-RA initiation. (A) Median platelet counts before and after TPO-RA initiation for the entire cohort. Median platelet counts of the 11 patients are represented from day 42 before TPO-RA initiation (D-42) until day 90 after TPO-RA initiation (D90). (B) Individual platelet counts before and after TPO-RA initiation. Platelet counts of the 11 patients treated with TPO-RAs are shown from D-42 until D90. CAR T-cell infusion is represented with a black dot. Platelet counts before CAR T-cell infusion are represented with dashed lines, and those after infusion are represented with continuous lines. (C) Platelet transfusion rates before and after TPO-RA initiation. Black bullet point represents CAR T-cell infusion. Each red bar represents a platelet transfusion.

