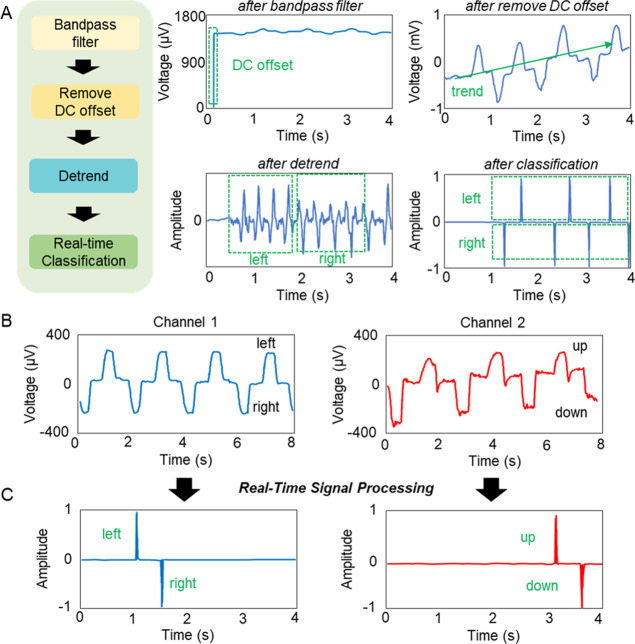
Figure 4.
Optimization of signal processing and feature extraction for real-time data classification. (A) Step-by-step sequence of processing of measured EOG signals from the wearable device; four different graphs on the right show examples of processed signals after each step, including bandpass filter, remove DC offset, detrend, and classification. (B) Representative examples of raw EOG signals and corresponding eye movements, including left, right, up, and down motions. (C) Set of classified signals after filtering and feature extraction.

