Figure 3.

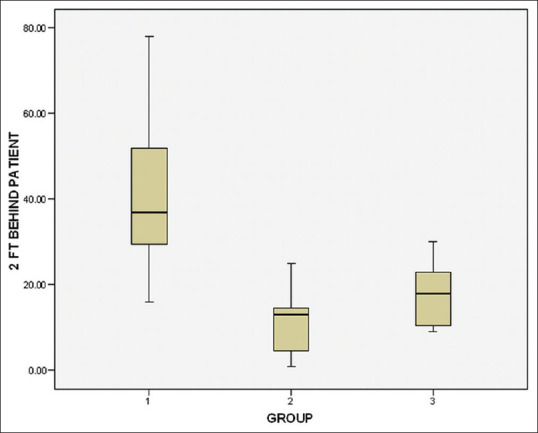
Box plot illustrating the total microbial counts colony-forming units at two feet beside the patient area showing the median and standard deviation

Box plot illustrating the total microbial counts colony-forming units at two feet beside the patient area showing the median and standard deviation