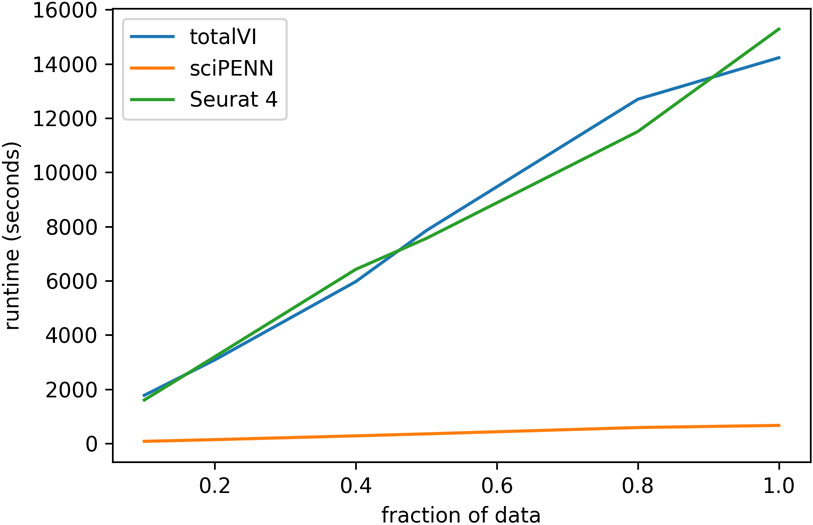
Extended Data Fig. 4. Runtime comparison of methods.
In this figure, we demonstrate the speed of sciPENN relative to other methods. Specifically, we use the Seurat 4 PBMC data as reference (161,746 cells) and the H1N1 data (53,201 cells) as query. Given a fraction f, we train each method using (100 * f)% of the Seurat 4 PBMC data and predict on (100 * f)% of the query data and record how long this process takes. We perform this for various fractions f for each method and plot the results.

