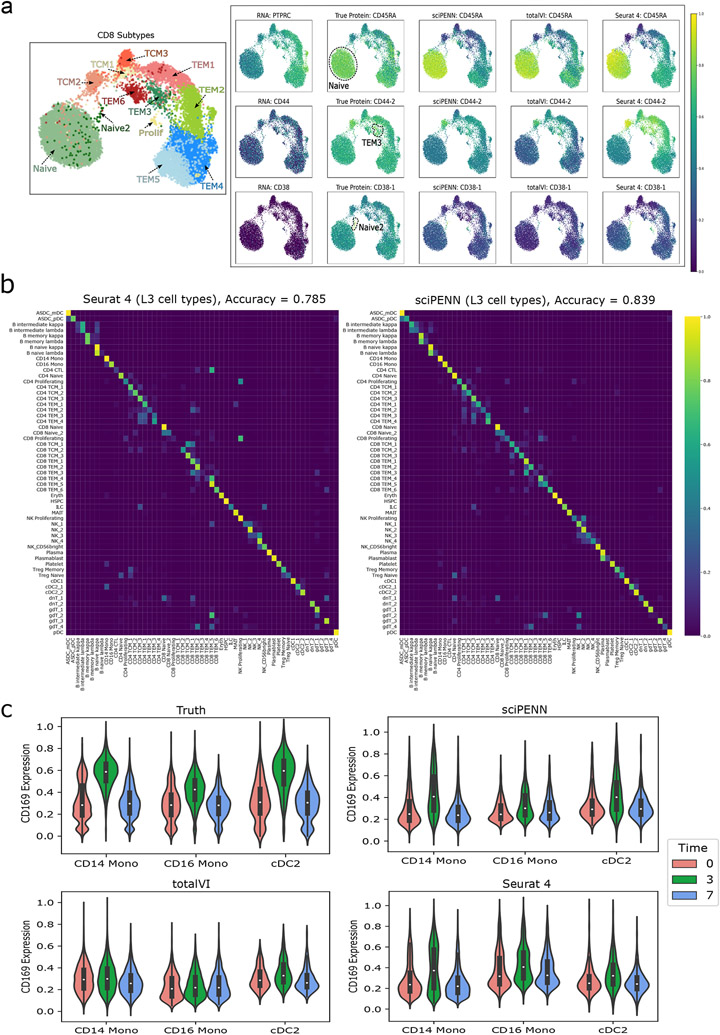
Fig. 4 ∣. Protein expression prediction and cell type label transfer in the PBMC dataset.
This figure illustrates the prediction of proteins and cell type label transfer in the PBMC test data (donors P2, P5, P6, P8) using the PBMC training data (donors P1, P3, P4, P7) as reference. a, UMAP plot on the left shows the CD8 cell subtypes reported in the Seurat 4 paper. UMAP plots on the right demonstrate the necessity of protein data to identify cell subpopulations by comparing UMAP colored by the true protein to the UMAP colored by the protein’s encoding RNA gene. Additional UMAPs colored by sciPENN, totalVI and Seurat 4 protein predictions demonstrate the utility of protein predictions for recovering these subpopulation behaviors when true protein data are missing, and sciPENN’s utility compared to other methods for most consistently recovering such trends. b, Confusion matrices which demonstrate the cell type prediction accuracy of sciPENN and Seurat 4 for each true cell type. Rows represent true cell type and columns represent predicted cell type. The raw matrix is first computed, and then normalized by each row’s sum, i.e., by the number of cells of each type. Element i, j of the numeric matrix can be thought of as the proportions of cells of type i which were classified as type j. c, Violin plots visualizing the CD169 protein’s feature values immediately before reception of a VSV-vectored HIV vaccine (Time = 0), 3 days after administration of the vaccine (Time = 3), and 7 days after administration (Time = 7). We examine the true CD169 expression with respect to Time, as well as sciPENN predicted, totalVI predicted, and Seurat 4 predicted CD169 expression with respect to time.

