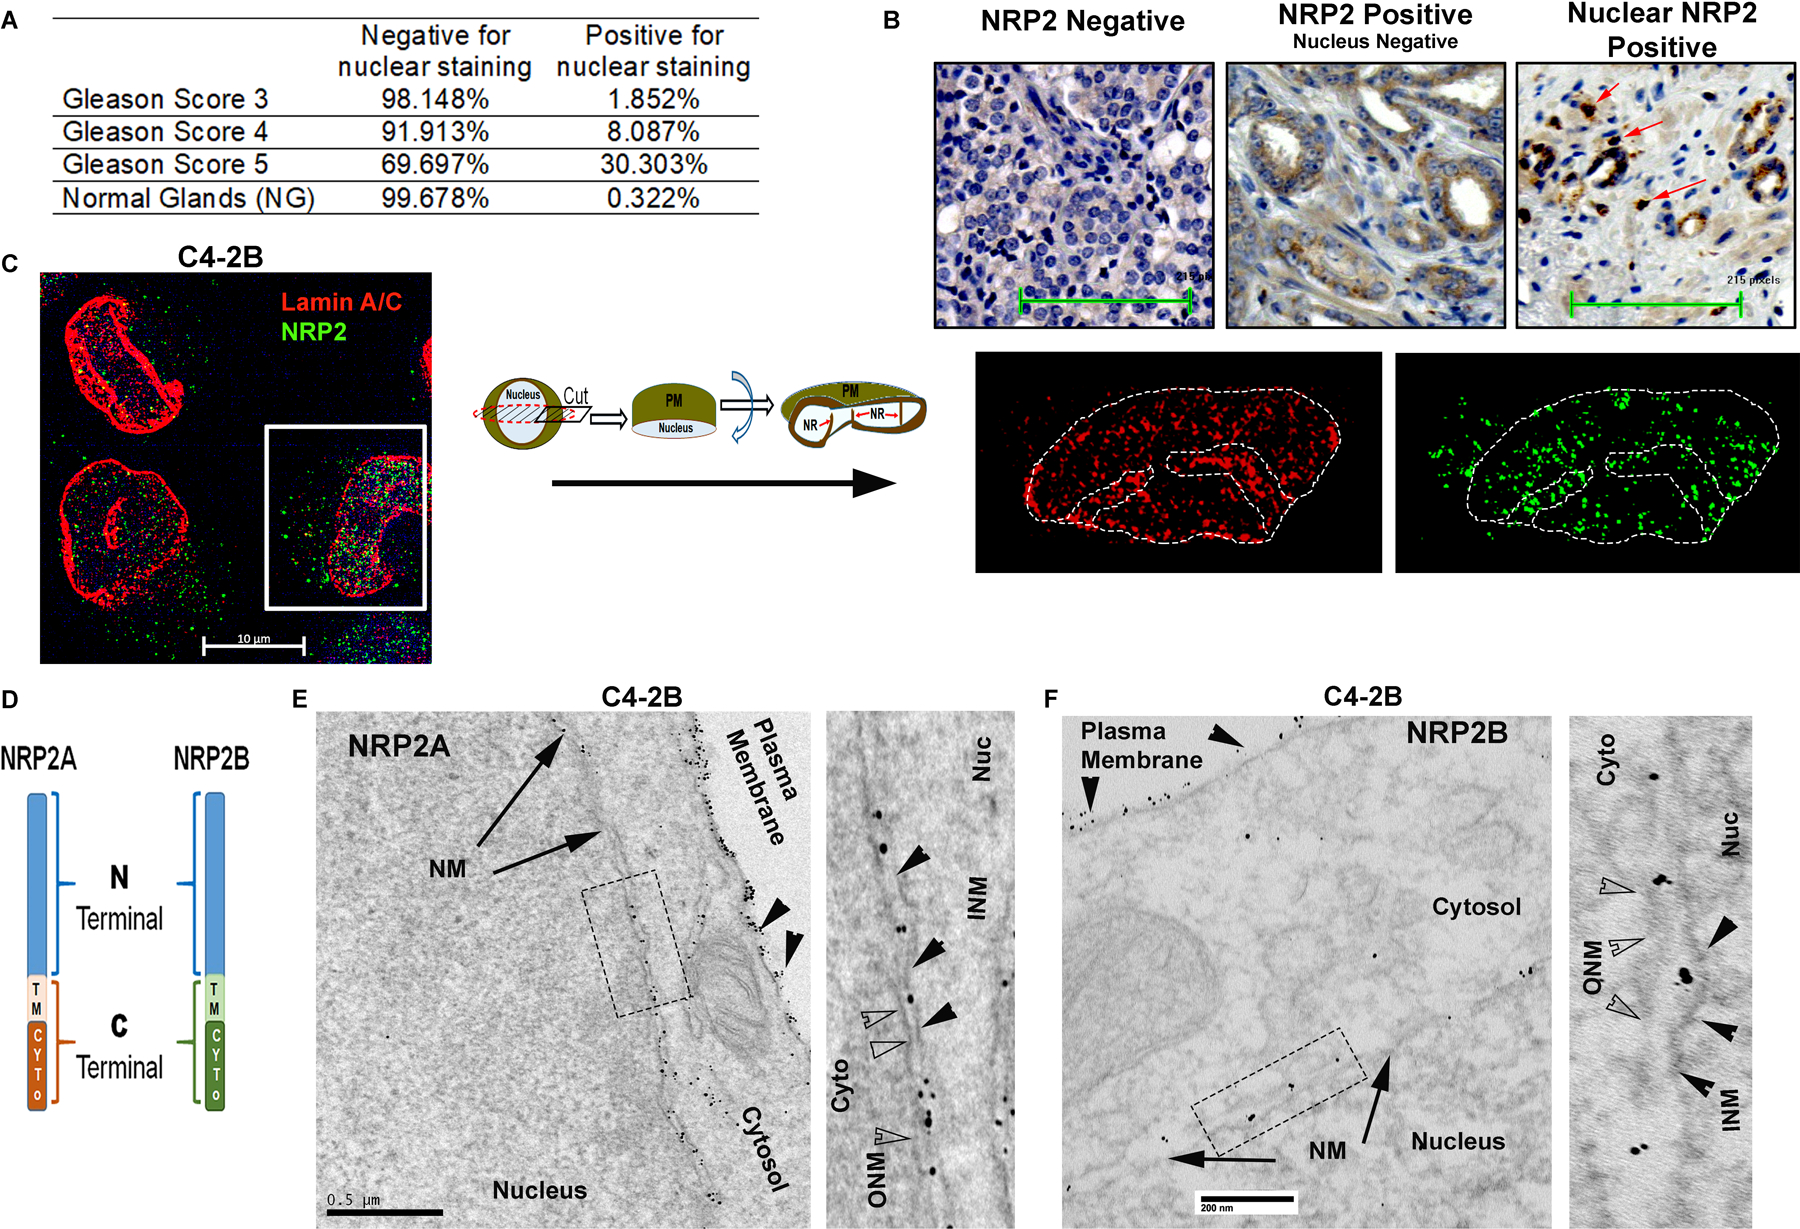
Fig. 1: NRP2 localization detected within the nucleus:

A. Percentage of nuclear NRP2-positive cells across the Gleason score. B. Representative images of immunohistochemical staining for nuclear NRP2 in human prostate cancer tissues. Arrows indicate the nuclear positive NRP2. C. Endogenous NRP2 staining (Alexa 488) in prostate cancer cell line C4–2B. INM was stained with lamin A/C (Alexa 594). DAPI indicates nuclear staining. Using Zen Blue lite software, cells were cut through the middle plane and then rotated across the x-axis. Inset is the magnified image of the nucleus of the cells. D. Schematic diagram of NRP2 isomers. E. TEM images of immunogold staining of untagged NRP2A in C4–2B cells ectopically expressing NRP2A. Cells were stained with NRP2 antibody and counterstained with gold-labeled secondary antibody. NRP2 staining appears as black punctate structures inside the cells. The nuclear and plasma membranes are indicated by the arrow and arrowhead, respectively. Inset is magnified. In the magnified image, ONM and INM are represented by opaque and black arrowheads, respectively. Scale Bar 500 nm. F. Representative TEM images of immunogold staining of HA-tagged NRP2B ectopically expressed in C4–2B. Cells were stained with HA-antibody and counterstained with gold-labeled secondary antibody. The nuclear membrane and plasma membrane are indicated by arrows and arrowheads, respectively. Insets is magnified. ONM and INM are represented by opaque and black arrowheads. Scale Bar 200 nm.
