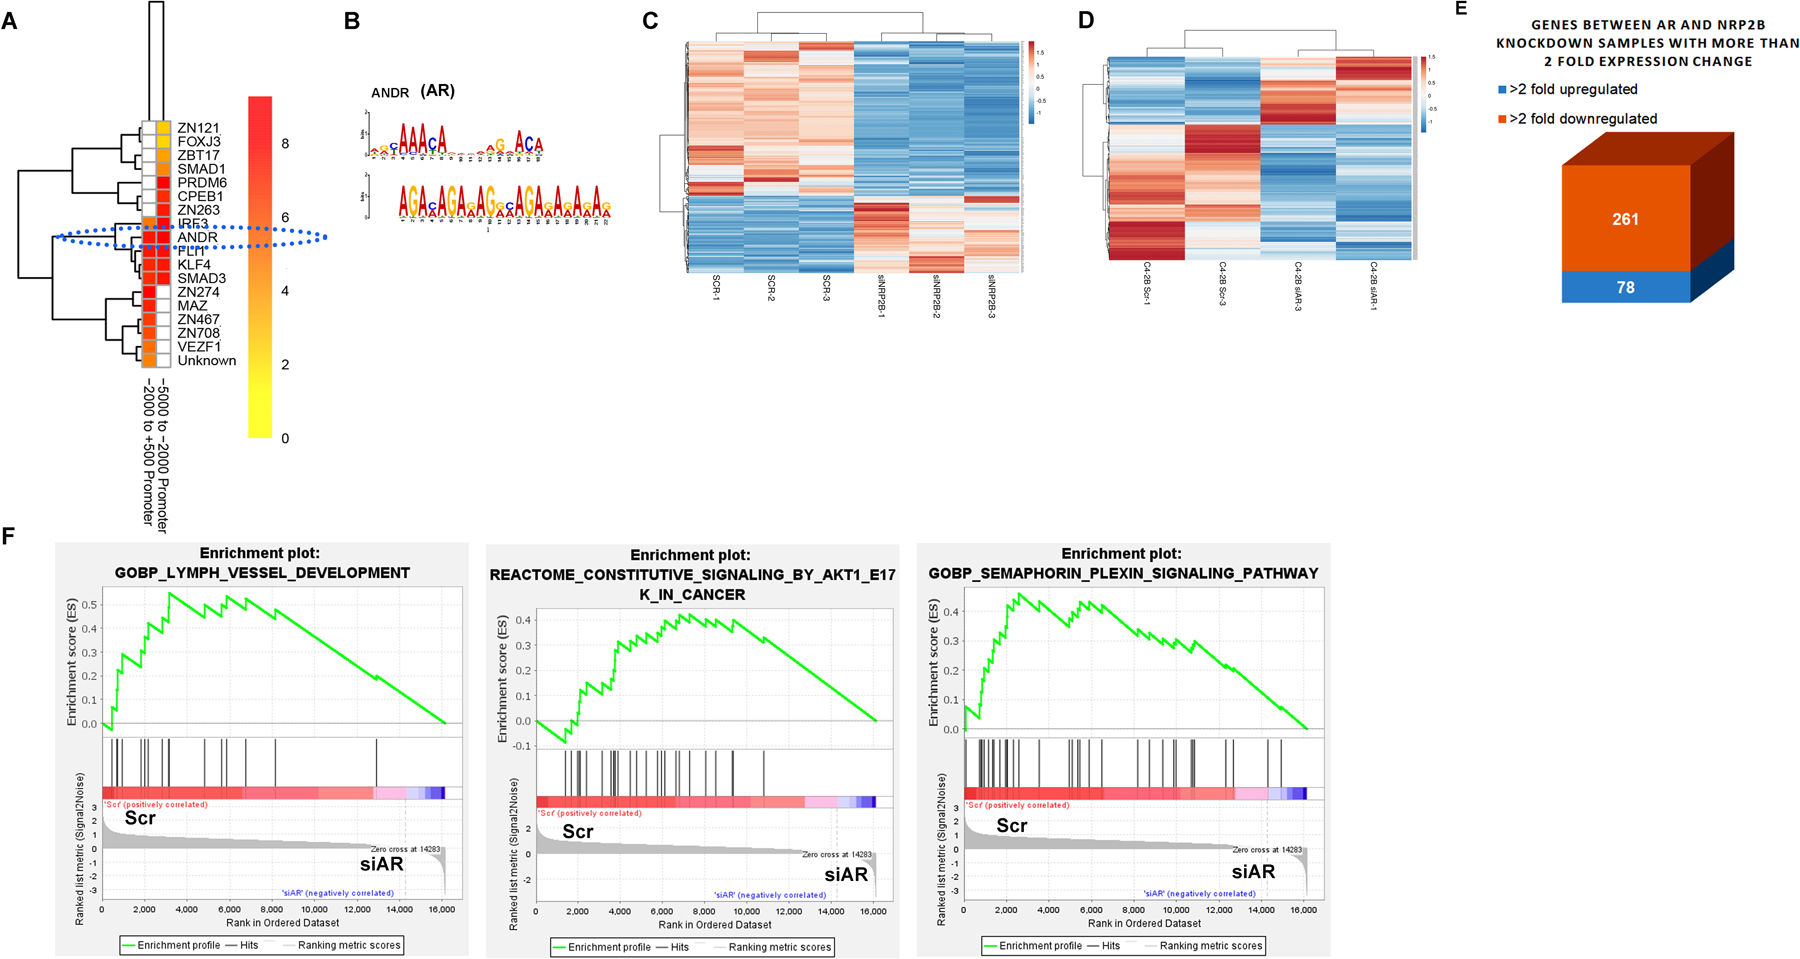
Fig. 5: Analysis of AR-NRP2 regulated gene expression:

A. TFs’ binding probability within the consensus sequence derived from the NRP2-ChIP-sequencing was predicted through the heat map analysis. Consensus sequence map was generated using the indicated regions of promoter sequence from the NRP2 ChIP-Seq. B. AR motifs was analyzed using the TOMTOM-MEME-motif analyzer. C. Heat map for RNA-sequencing analysis of 200 differentially downregulated and 100 upregulated genes following depletion of NRP2B. D. Heat map of gene expression profile following the depletion of AR by siRNA. E. Box diagram representing the common up and down-regulated gene expression following AR and NRP2B depletion. F. GSEA analysis using AR-regulated genes.
