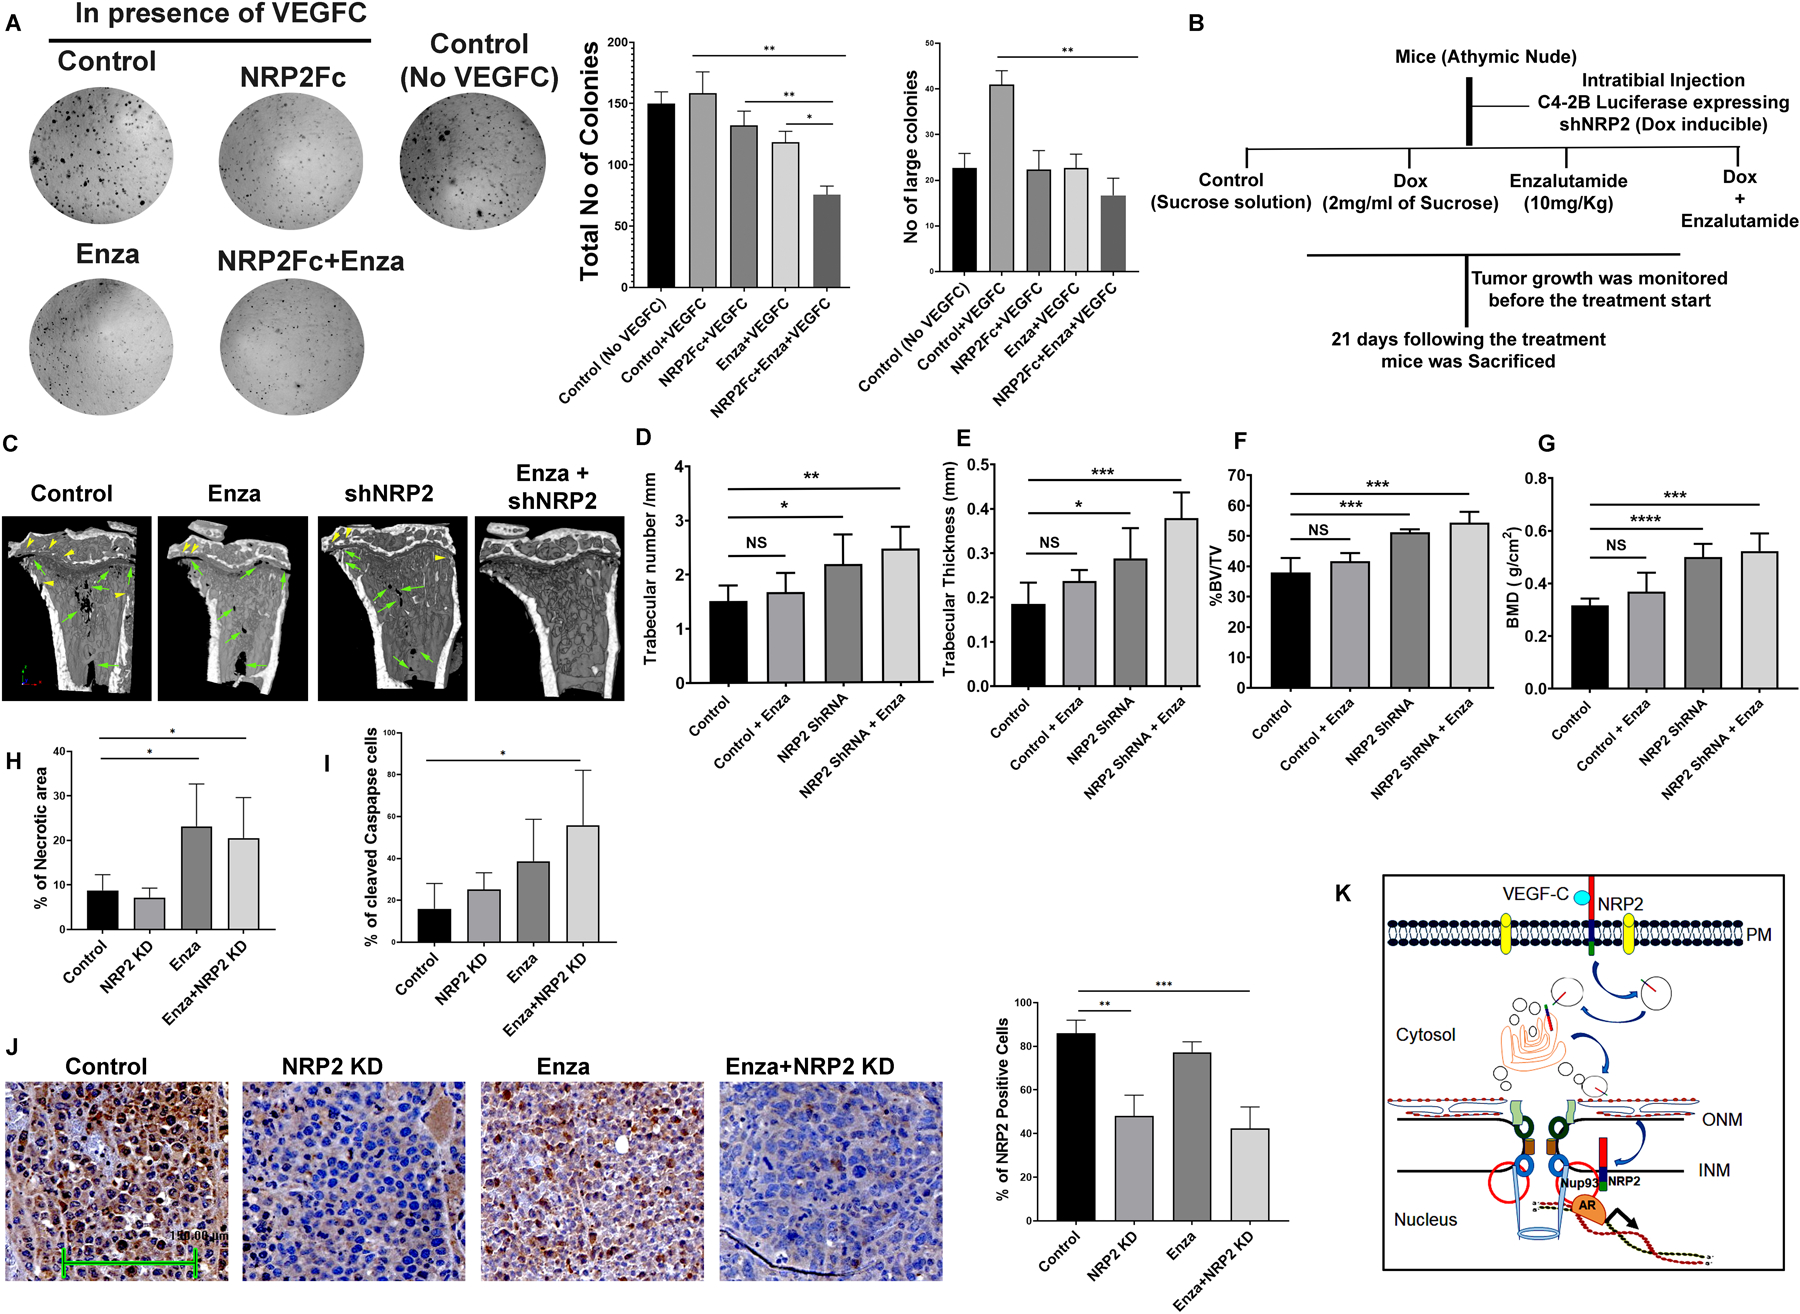
Fig. 7: Inhibition of nuclear transport of NRP2 increased AR-targeted therapeutic efficacy:

A. A colony formation assay was performed under VEGF-C treated condition to test for sensitivity to enzalutamide following the addition of NRP2Fc. The colony formation was also analyzed with VEGF-C untreated cells. Right, bar diagrams represent the number of colonies and the relative size of the colonies under the experimental conditions. B. Schematic diagram of intratibial injection. C. micro-CT images of tumor containing bone under various condition. D-G. Bone morphometric analysis in terms of trabecular number, Trabecular thickness, Bone volume (BV)/ total volume (TV) and bone mass density (BMD) of bone under different condition. H. Analysis of tumor necrosis under various condition. I. IHC analysis for Cleaved caspase staining under different experimental condition. J. IHC for NRP2 staining under different experimental condition to show the knockdown efficiency in tumor cell. K. Schematic diagram representing how NRP2 is translocated from the plasma membrane to the nucleus of the cells to regulate TF-DNA interactions.
