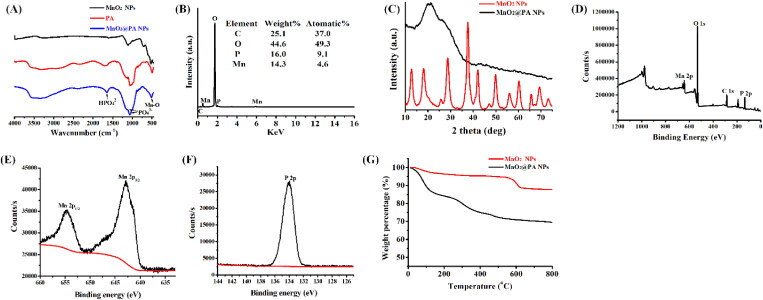
Figure 3.
Characterization of MnO2@PA NPs oligomer. A: FTIR spectra of PA, MnO2 NPs, and MnO2@PA NPs oligomer. B: EDS spectra of MnO2@PA NPs oligomer. C: XRD spectra of MnO2 NPs and MnO2@PA NPs oligomer. D–F: XPS spectra of MnO2@PA NPs oligomer, Mn and P elements. G: The thermogravimetric curves of MnO2 NPs and MnO2@PA NPs oligomer.

