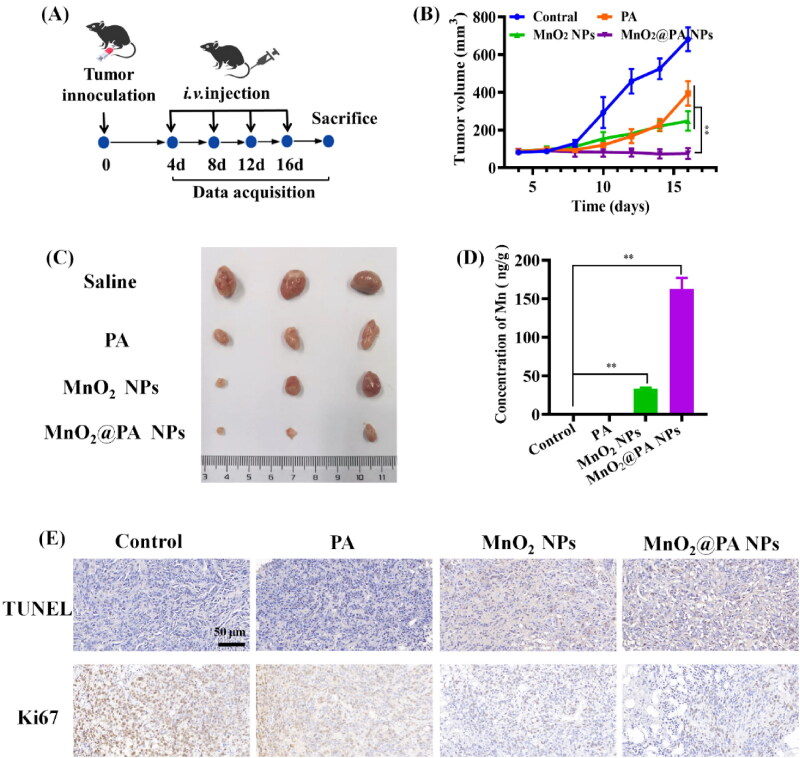
Figure 7.
In vivo antitumor efficacy evaluation of PA, MnO2 NPs and MnO2@PA NPs oligomer in 143B tumor-bearing mice. A: The dosage frequency of therapeutics after tumor inoculation. Mice received 20 mg/kg of PA, MnO2 NPs or MnO2@PA NPs. B: The tumor growth curves after i.v. injection of PA, MnO2 NPs, and MnO2@PA NPs oligomer. The data were shown as mean ± SD, **p < .01 vs. PA group and MnO2 NPs group. C: The excised tumor images with PA, MnO2 NPs, or MnO2@PA NPs oligomer treatment. D: The contents of manganese in excised tumor. The data were shown as mean ± SD, **p < .01 vs. control group. E: TUNEL detection and immunohistochemistry assay for Ki67 in tumor tissues, (scale bar: 50 μm).

