Figure 2.
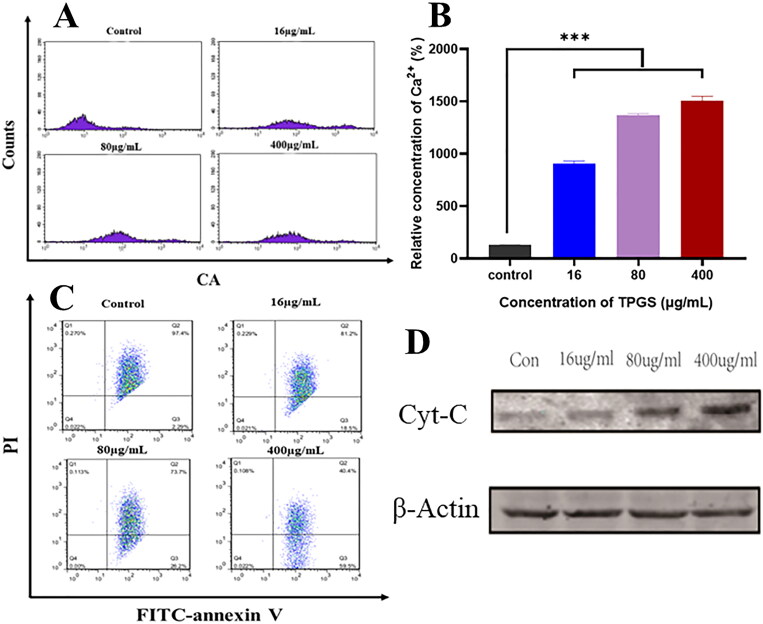
TPGS-induced mitochondrial damage in MCF-7-ADR cells. (A) The effects of different TPGS concentrations (0, 16, 80, and 400 μg/mL) on intracellular Ca2+ levels in MCF-7-ADR cells, (B) relative Ca2+ concentration differences at different TPGS concentrations (0, 16, 80, and 400 μg/mL) in MCF-7-ADR cells, (C) the effects of different TPGS concentrations (0, 16, 80, and 400 μg/mL) on mitochondrial membrane potential, (D) the effects of different TPGS concentrations on mitochondrial cytochrome C release (n = 3, ***p < 0.001).

