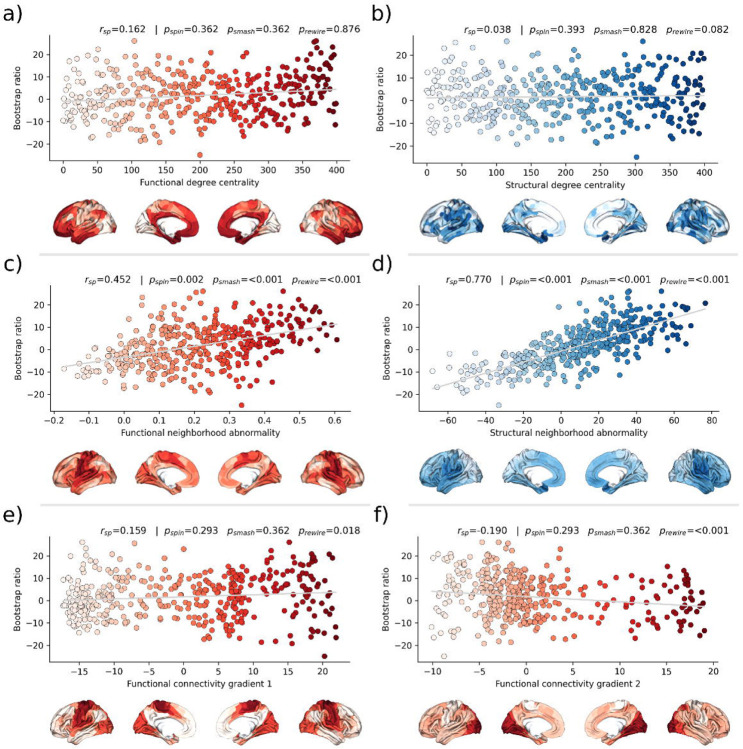
Figure 4. Brain network contextualization.
Spatial correlation results derived from relating Schaefer400×7-parcellated cortical maps of MetS effects (bootstrap ratio) to network topological indices (red: functional connectivity, blue: structural connectivity). Scatter plots that illustrate the spatial relationship are supplemented by respective surface plots for anatomical localization. The color coding of cortical regions and associated dots corresponds. a) & b) Functional and structural degree centrality rank. c) & d) Functional and structural neighborhood abnormality. e) & f) Intrinsic functional network hierarchy represented by functional connectivity gradients 1 and 2. Complementary results concerning t-statistic maps derived from group comparisons between MetS subjects and controls are presented in supplementary figure S22. Abbreviations: prewire - p-value derived from network rewiring [45]; psmash - p-value derived from brainSMASH surrogates [44]; pspin - p-value derived from spin permutation results [43]; rsp - Spearman correlation coefficient.

