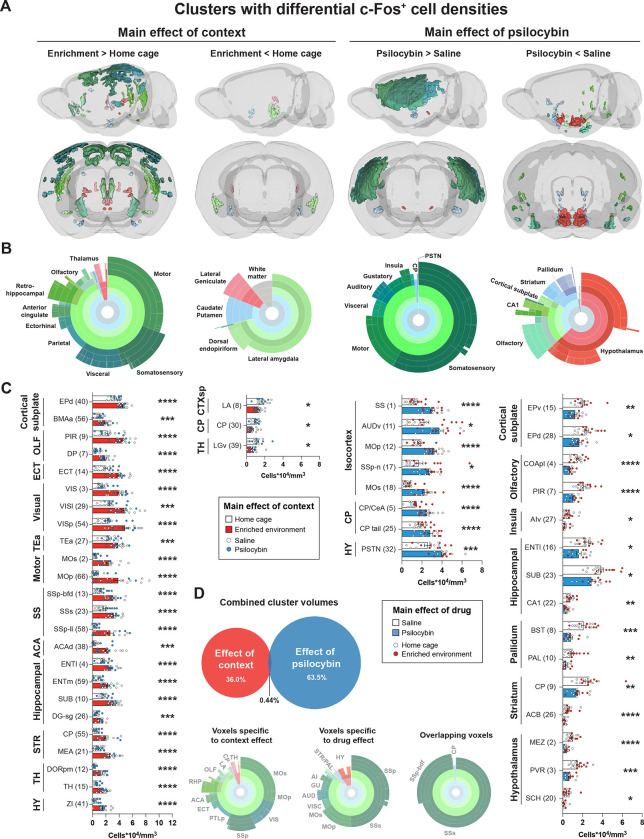
Figure 2: Main effects of context and psilocybin on c-Fos-IF.
Clusters with a confirmed difference in c-Fos+ cell density are shown. Data is separated in columns based on main effects and effect directions. A) 3D view of clusters from main effects surviving voxel-wise FDR correction (q < 0.01) with Allen brain atlas (ABA) coloring. B) Sunburst plots representing the relative proportion of region volumes for valid clusters at all levels of the ABA (inner rings represent parent regions, whereas outer rings represent the finest level of anatomical granularity). C) Post hoc unpaired t-tests of c-Fos+ cell density measurements for each cluster. Cluster numbers are in parenthesis. The largest component region of each cluster is indicated. Additional significant and non-significant clusters are presented in Figure S2A–D. D) Relative volumes of main effects, overlap, and corresponding regional volumes. Abbreviations are defined in Table S1. Raw densities and p values for all clusters are in Table S2. *p < 0.05, ** p < 0.01, ***p < 0.001, ****p < 0.001.

