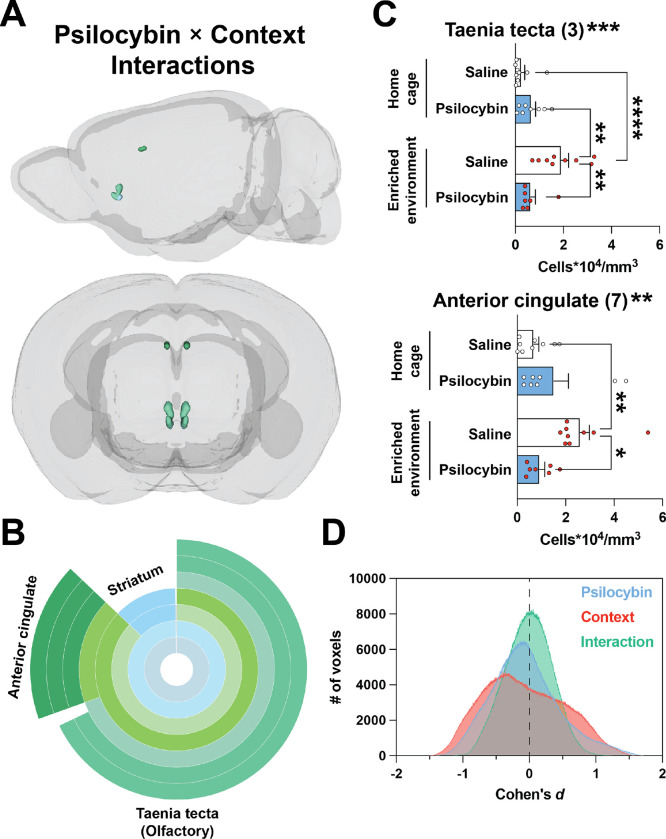
Figure 3: Modest interactions between context and psilocybin.
Clusters are shown that survived voxel-wise FDR correction (q < 0.15) and had a confirmed interaction based on post hoc 2×2 ANOVAs of c-Fos+ cell density measurements. A) 3D view of valid interaction clusters. B) Sunburst plot representing regional volumes. C) Post hoc 2×2 ANOVAs of c-Fos+ cell densities. Interaction significance is above the graphs. See Figure S2E for non-significant clusters. D) The effect size for each voxel for each contrast is plotted as a histogram binned in steps of Cohen’s d = 0.001. *p < 0.05, ** p < 0.01, ***p < 0.001, ****p < 0.001.

