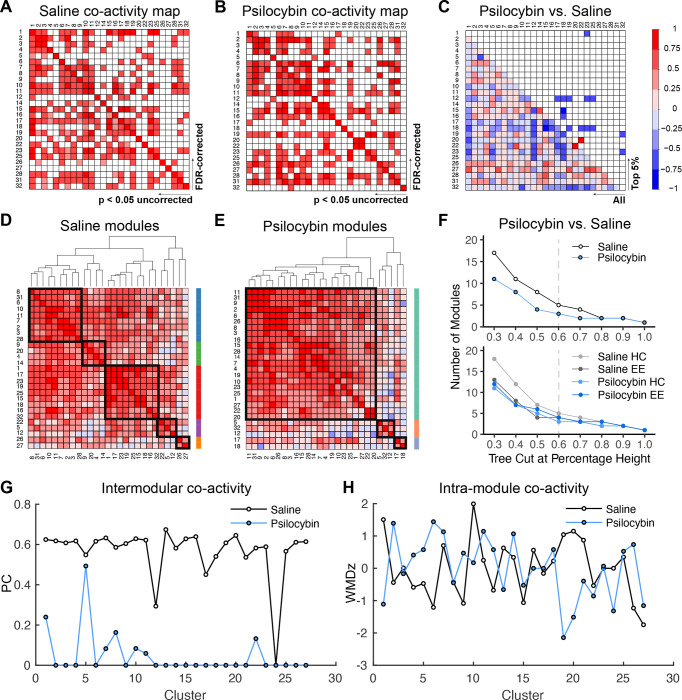
Figure 4: Network analysis of neural populations sensitive to psilocybin.
A,B) Pearson correlation matrix of c-Fos+ cell densities, in valid clusters where psilocybin altered activity, following treatment of A) saline or B) psilocybin. FDR-corrected (q < 0.05) and uncorrected correlations are above and below the diagonal, respectively. C) Difference map of the Pearson R coefficients. The color scale represents the degree of correlation (Pearson’s r) for each cluster pair. D,E) Hierarchical clustering of uncorrected correlation coefficients at a tree height of 60% indicated the presence of D) five distinct modules in saline-treated brains and E) three modules in psilocybin-treated brains. Tree-based representations of hierarchical clustering are outside of the correlograms. Black squares in the correlograms and the colored bars demarcate co-activity modules. F) Dendrogram cutting at different tree heights indicates the stability of decreased modularity in the psilocybin-treated cohort. The dashed line represents the selected tree height. G) Intra- and H) inter-modular co-activity for each cluster for saline and psilocybin conditions.

