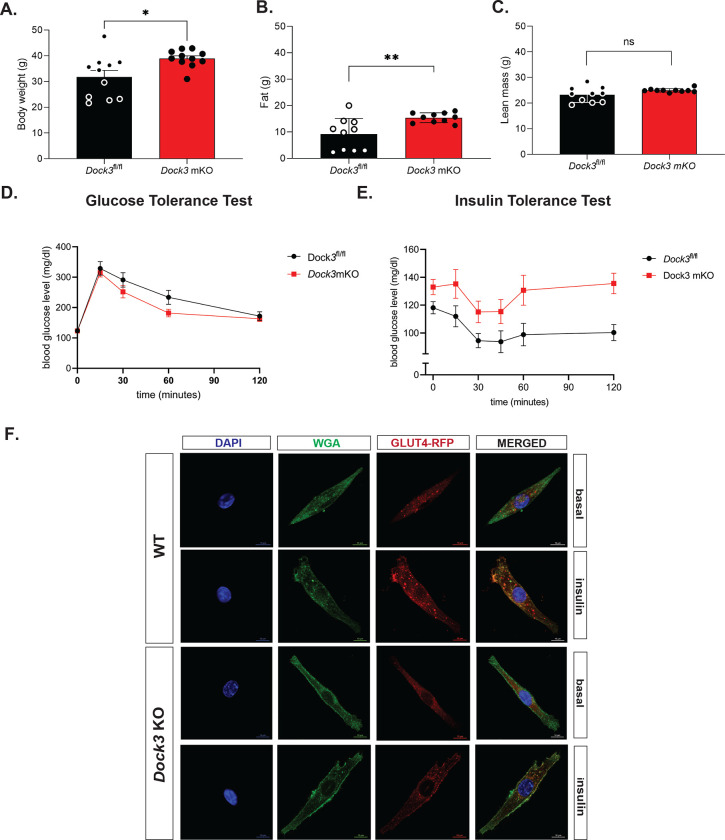
Figure 5. Dock3 mKO mice show increased body mass and whole body hyperglycemia.
A. Quantitative magnetic resonance imaging indicated body weight differences between Dock3fl/fl and Dock3 mKO mice, n = 10 mice/cohort, *p < 0.01. B. Quantitative magnetic resonance imaging indicated differences in fat mass between Dock3fl/fl and Dock3 mKO mice, n = 10 mice/cohort, *p < 0.001. C. Quantitative magnetic resonance imaging indicating differences in lean mass between Dock3fl/fl and Dock3 mKO mice, n = 10 mice/cohort, ns = not significant. D. Glucose Tolerance Test in Dock3fl/fl and Dock3 mKO mice shown. Serum blood glucose level (mg/dl) measured over time (minutes). E. Insulin Tolerance Test in Dock3fl/fl vs. Dock3 mKO mice. n = 8 mice/cohort. Serum blood glucose level (mg/dl) measured over time (minutes). F. WT and Dock3 KO myoblasts transfected with HA-GLUT-RFP. Wheat germ agglutinin stained membranes (green), GLUT4 (RFP), and nuclei are stained with DAPI. Scale bar = 10 μm.

