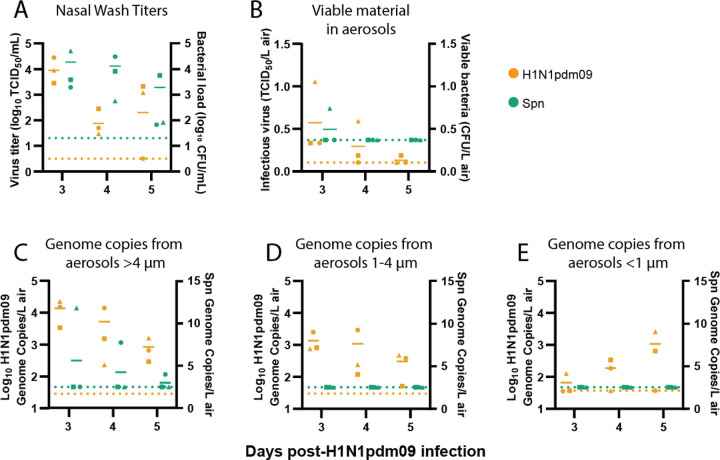
Figure 1. Co-infected ferrets shed H1N1pdm09 and Spn.
Ferrets were infected with 106 TCID50 of H1N1pdm09 and subsequently infected 2 days later with 107 CFU S. pneumoniae D39. (A) Nasal wash loads of H1N1pdm09 and Spn are shown for the days following initial H1N1pdm09 infection. (B) Condensation sampling with a Liquid Spot Sampler was used to collect infectious virus and bacteria shed by co-infected animals. Viral and bacterial loads were measured by TCID50 and CFU assays, respectively. (C-E) Cyclone based air samplers were used to fractionate and collect microbial genomic material shed from co-infected ferrets in (C) >4 µm droplets, (D) 1–4 µm droplets, and (E) <1 µm droplets. Quantitative PCR was used to measure genome copies for each microbe. For all graphs, orange symbols represent H1N1pdm09 (N=3) and green symbols represent Spn (N=3), with each animal indicated by a unique shape and the mean indicated by short, solid lines. Dotted lines denote the limit of detection for H1N1pdm09 (orange) and Spn (green).

