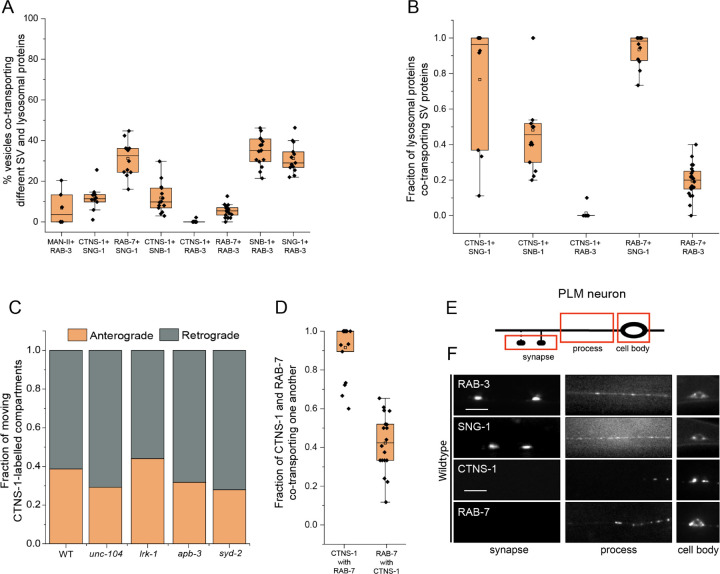
Figure 1: Synaptic vesicle proteins travel with lysosomal proteins in heterogenous carriers.
(A) Quantitation of co-transport of different combinations of synaptic vesicle proteins and lysosomal proteins from kymograph analysis of dual color imaging. The number of animals per genotype (N) ≥ 10. Number of vesicles analyzed (n) > 600.
(B) Quantitation of fraction of different lysosomal proteins co-transporting different synaptic vesicle proteins from kymograph analysis of dual color imaging. N ≥ 10; n > 100.
(C) Quantitation of fraction of CTNS-1-labelled compartments moving in the anterograde and retrograde direction in different mutants. N ≥ 9 per genotype; the number of CTNS-1-labelled compartments ≥ 20.
(D) Quantitation of co-transport of CTNS-1::mCherry and mNeonGreen::RAB-7 in WT animals from sequential dual color imaging at 1.3 fps. CTNS-1 with RAB-7 indicates the fraction of CTNS-1-labelled compartments co-transporting RAB-7. RAB-7 with CTNS-1 indicates the fraction of RAB-7-labelled compartments co-transporting CTNS-1. N ≥ 15 animals; n > 450.
(E) Schematic showing the PLM neuron. Red boxes highlight the regions of imaging. The arrow shows the anterograde direction of vesicle motion.
(F) GFP::RAB-3, SNG-1::GFP, CTNS-1::mCherry, and RAB-7::mScarlet in the cell body, process and synapses of wildtype PLM neurons. Scale bar: 10 μm.

