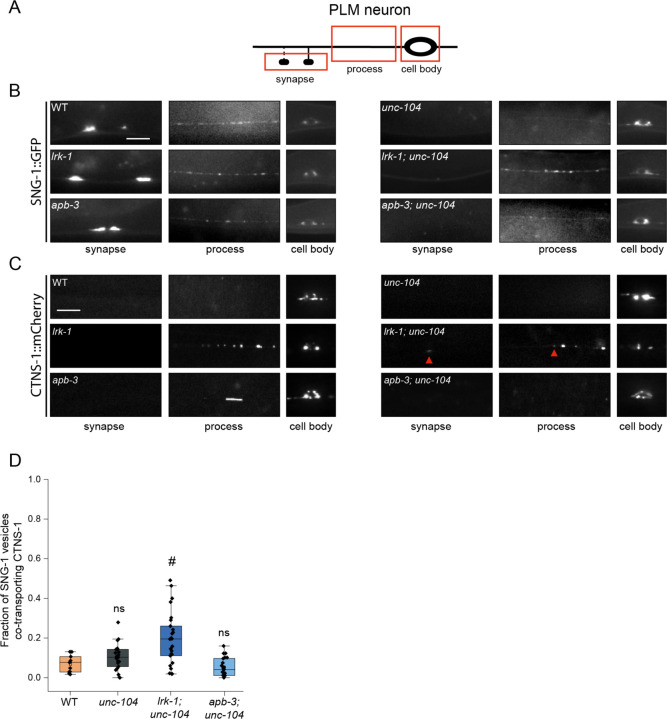
Figure 3: SV-lysosomes in lrk-1 and apb-3 mutants are dependent on UNC-104.
(A) Schematic showing the PLM neuron. Red boxes highlight the regions of imaging.
(B) SNG-1::GFP in the cell body, process, and synapses of PLM neurons showing dependence on UNC-104 in lrk-1(km17) and apb-3(ok429) mutants and their doubles with unc-104(e1265tb120). Scale bar: 10 μm.
(C) CTNS-1::mCherry in the cell body, process, and synapses of PLM neurons showing dependence on UNC-104 in lrk-1(km17) and apb-3(ok429) mutants and their doubles with unc-104(e1265tb120). Red arrows highlight fainter CTNS-1 puncta. Scale bar: 10 μm.
(D) Quantitation of co-transport of SNG-1 and CTNS-1 in unc-104(e1265tb120), lrk-1(km17); unc-104, and apb-3(ok429); unc-104 from kymograph analysis of sequential dual color imaging done at 1.3 fps. #P-value ≤ 0.05 (Mann–Whitney Test, all comparisons to WT); ns: not significant; Number of animals (N) ≥ 18 per genotype; Number of vesicles (n) > 1200.

