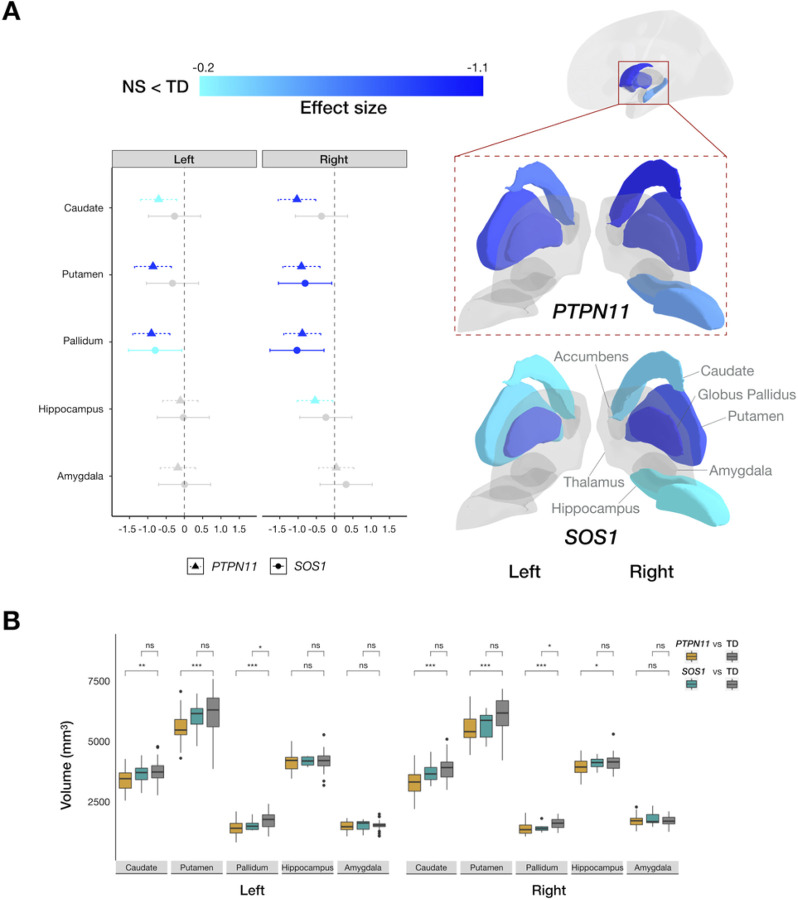
Figure 1.
Subcortical structures affected by PTPN11 and SOS1 variants in Noonan syndrome. (A) Left: 95% confidence interval plot of PTPN11GMV effect sizes with cooler colors indicating larger negative values (NS < TD) and shapes and line types representing groups (PTPN11 and SOS1); Right: Effects of PTPN11 and SOS1 variants in Noonan syndrome on subcortical anatomy indicated by effect sizes mapped onto a three-dimensional representation of bilateral subcortical brain regions. (B) Boxplots representing subcortical volumes in the PTPN11, SOS1, and TD groups. In PTPN11, we found smaller bilateral caudate (ANCOVA: left: F(1, 65)=10.11, p=0.0060, d=−0.70; right: F(1, 65)=22.61, p=0.00012, d=−1.03), putamen (left: F(1, 65)=17.28, p=0.00031, d=−0.86; right: F(1, 65)=21.01, p=0.00012, d=−0.91), and pallidum (left: F(1, 65)=20.79, p=0.00012, d=−0.91; right: F(1, 65)=19.60, p=0.00015, d=−0.88) and smaller right hippocampal GMV (F(1, 65)=6.071, p=0.029, d=−0.53) relative to the TD group. Similar to PTPN11, we found smaller pallidum GMV, bilaterally, (t-test: left: t(39)=−2.94, p=0.038, d=−0.80; right: t(39)=−3.74, p=0.012, d=−1.03) in the SOS1 group compared to the TD group. Between-group differences are denoted for significance (*p<0.05, **p<0.01, ***p<0.001, ns: not statistically significant).

