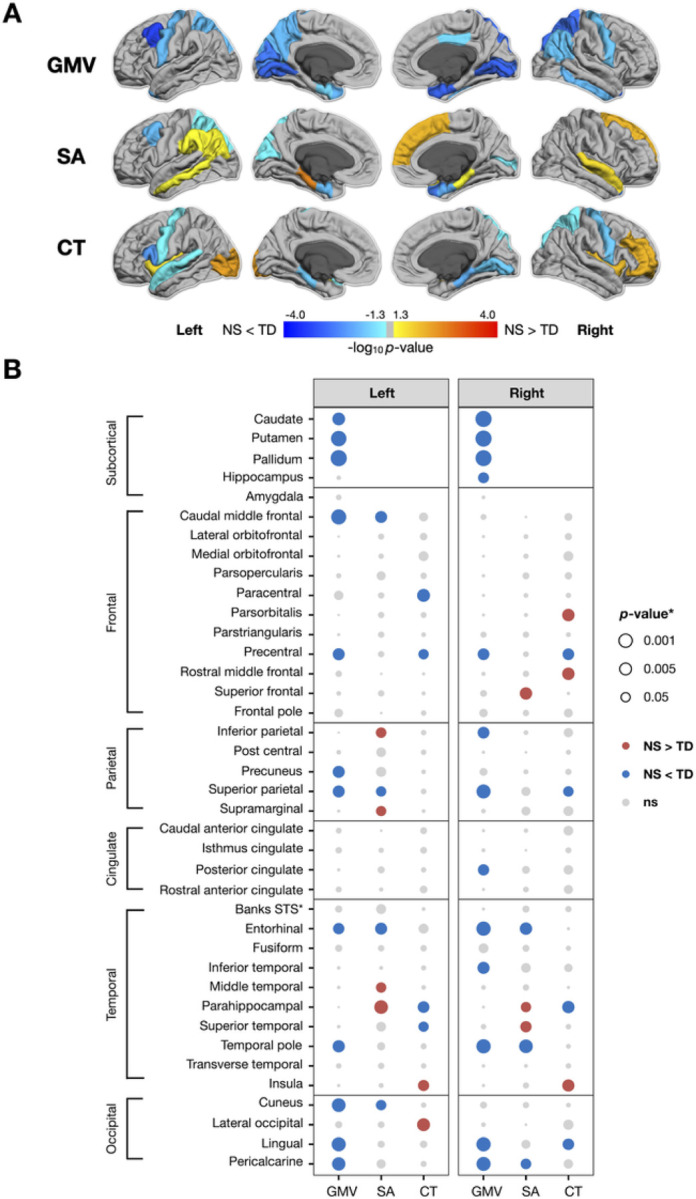
Figure 2.

Significance (p-value) of changes in gray matter volume (GMV), surface area (SA), and cortical thickness (CT) in the PTPN11 group. Dorsal aspects of the frontal and parietal lobes, as well as medial temporal and occipital regions, were particularly affected by PTPN11 variants. (A) p-values of changes in gray matter volume (GMV), surface area (SA), and cortical thickness (CT) mapped to cortical ROIs with cooler colors indicating NS < TD and warmer colors indicating NS > TD, converted to −log10 (p) for visualization purposes. (B) p-values of changes in GMV, SA, and CT organized by hemisphere with rows for ROIs, columns for measures, dot color representing the direction of differences (blue: negative or NS < TD; red: positive or NS > TD), and dot size representing magnitude of p-values.
