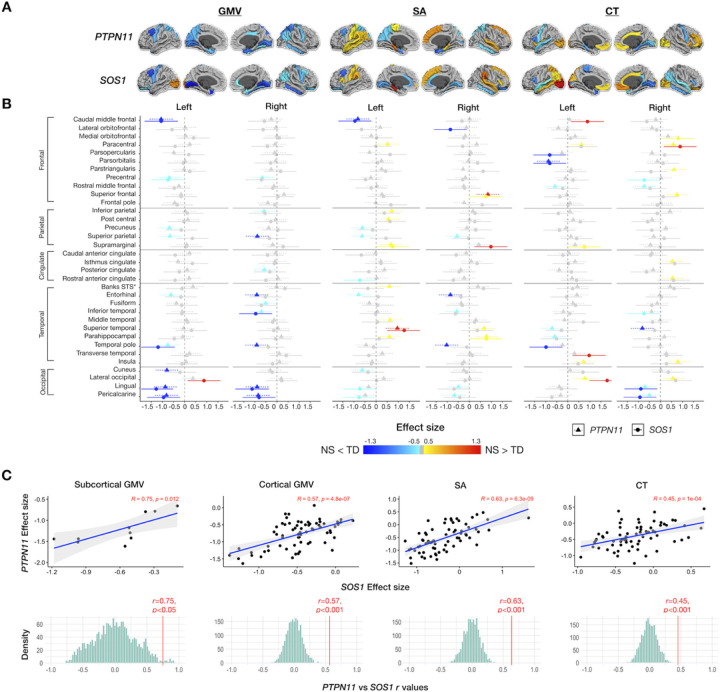
Figure 3.
Effect sizes of gray matter volumes (GMV), surface area (SA), and cortical thickness in NS variants (PTPN11 and SOS1). PTPN11 and SOS1 variants in Noonan syndrome affect cortical anatomy of similar cortical regions, generally in the same direction, with PTPN11having a more pronounced effect than SOS1. (A) Effect sizes of gray matter volume (GMV), surface area (SA), and cortical thickness (CT) mapped to cortical ROIs with cooler colors indicating NS < TD and warmer colors indicating NS > TD (B) 95% confidence interval plots of PTPN11 and SOS1 effect sizes organized by hemisphere and measure (GMV, SA, CT) with rows for ROIs, colors indicating direction of effect size (cooler colors: negative or NS < TD; warmer colors: positive or NS > TD, gray: non-significant values), and shapes and line types representing groups (PTPN11 and SOS1) (C) Scatterplots illustrating the close coherence between effect sizes of NS status (PTPN11 or SOS1) on subcortical and cortical gray matter volumes and gray matter determinants (SA and CT) between the PTPN11 and SOS1 groups and permutation testing distributions (with 2,000 null r values) demonstrating that observed correlations are significantly greater than null expectations.

