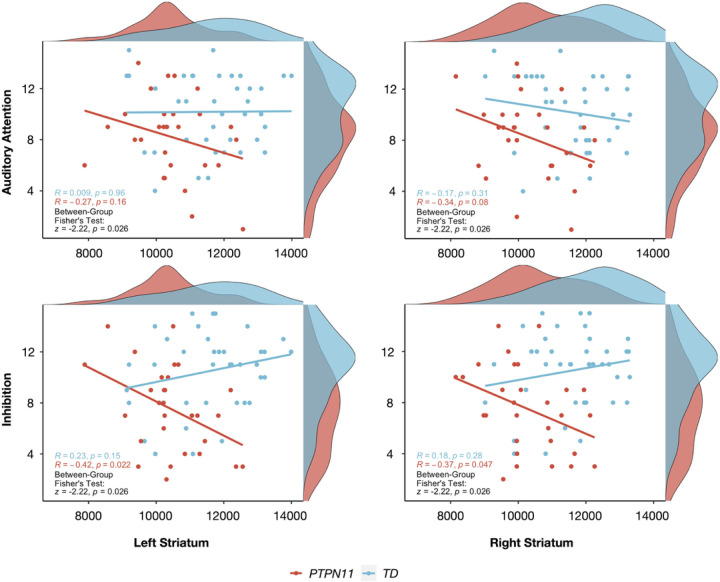
Figure 4.
Disruption of normative anatomical-behavioral relationships relevant to attention and inhibition in Noonan syndrome. Pearson correlations between Auditory Attention or Inhibition scores and striatal volumes (in mm3) for each group and Fisher’s Exact Tests (with FDR corrected p-values) assessing differences between PTPN11 and TD groups in brain-behavioral correlations. Participants are represented by individual dots and distribution plots of the data are displayed on the outer x- and y-axes.

