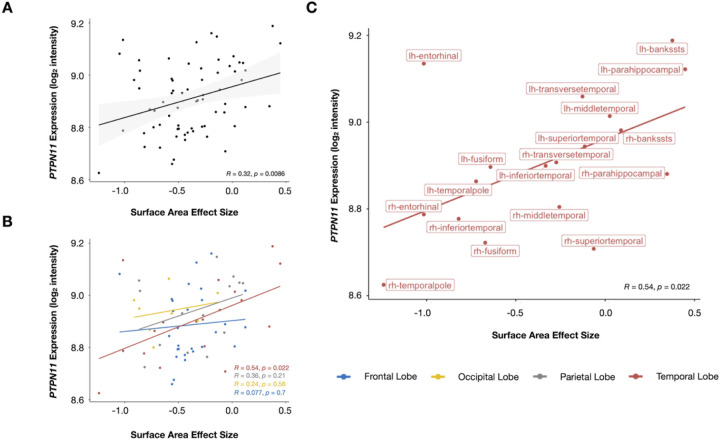
Figure 5.
PTPN11 expression positively correlated with surface area effect size. (A) Whole-brain, (B) lobe-wise, and(C) temporal lobe-specific correlation analyses between PTPN11 expression and surface area effect size, which quantifies group differences in surface area between the PTPN11 and TD groups. Individual dots represent cortical regions and dot colors denote which lobe the region is part of. Regression lines between surface area effect size and PTPN11 expression (log2 intensity) for the whole brain (A: black, B: blue (frontal lobe), yellow (occipital lobe), gray (parietal lobe), red (temporal lobe), and C: red (temporal lobe)). Shaded areas in (A) represent 95% confidence intervals.

