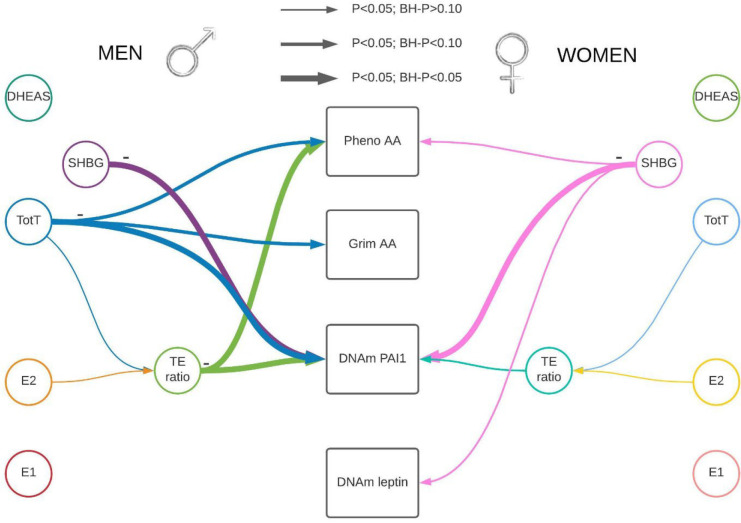
Figure 1. Visual representation of our main results stratified by sex.
There were four outcomes of interest in the rectangular shapes in the middle of this figure, Pheno-Age Acceleration (AA), Grim AA, and DNAm-based PAI1 and DNAm-based leptin. We measured five hormone concentrations (testosterone, estrone, estradiol, DHEAS, and Sex Hormone Binding Globulin (SHBG)). In addition, one hormone level ratio (testosterone / estradiol) was estimated. Associations identified in a linear mixed regression model are represented by colored arrows between sex hormones and the outcomes of interests, with the lines’ thickness representing the strength of the association. Hormone levels were inversely associated with epigenetic estimators of mortality risk.
Abbreviations: E1: total estrone; E2: total estradiol; SHBG: Sex Hormone Binding Globulin; TotT: total testosterone; TE ratio: Total testosterone divided by total estradiol concentration

